Poker News
News
16:53, Jun 19
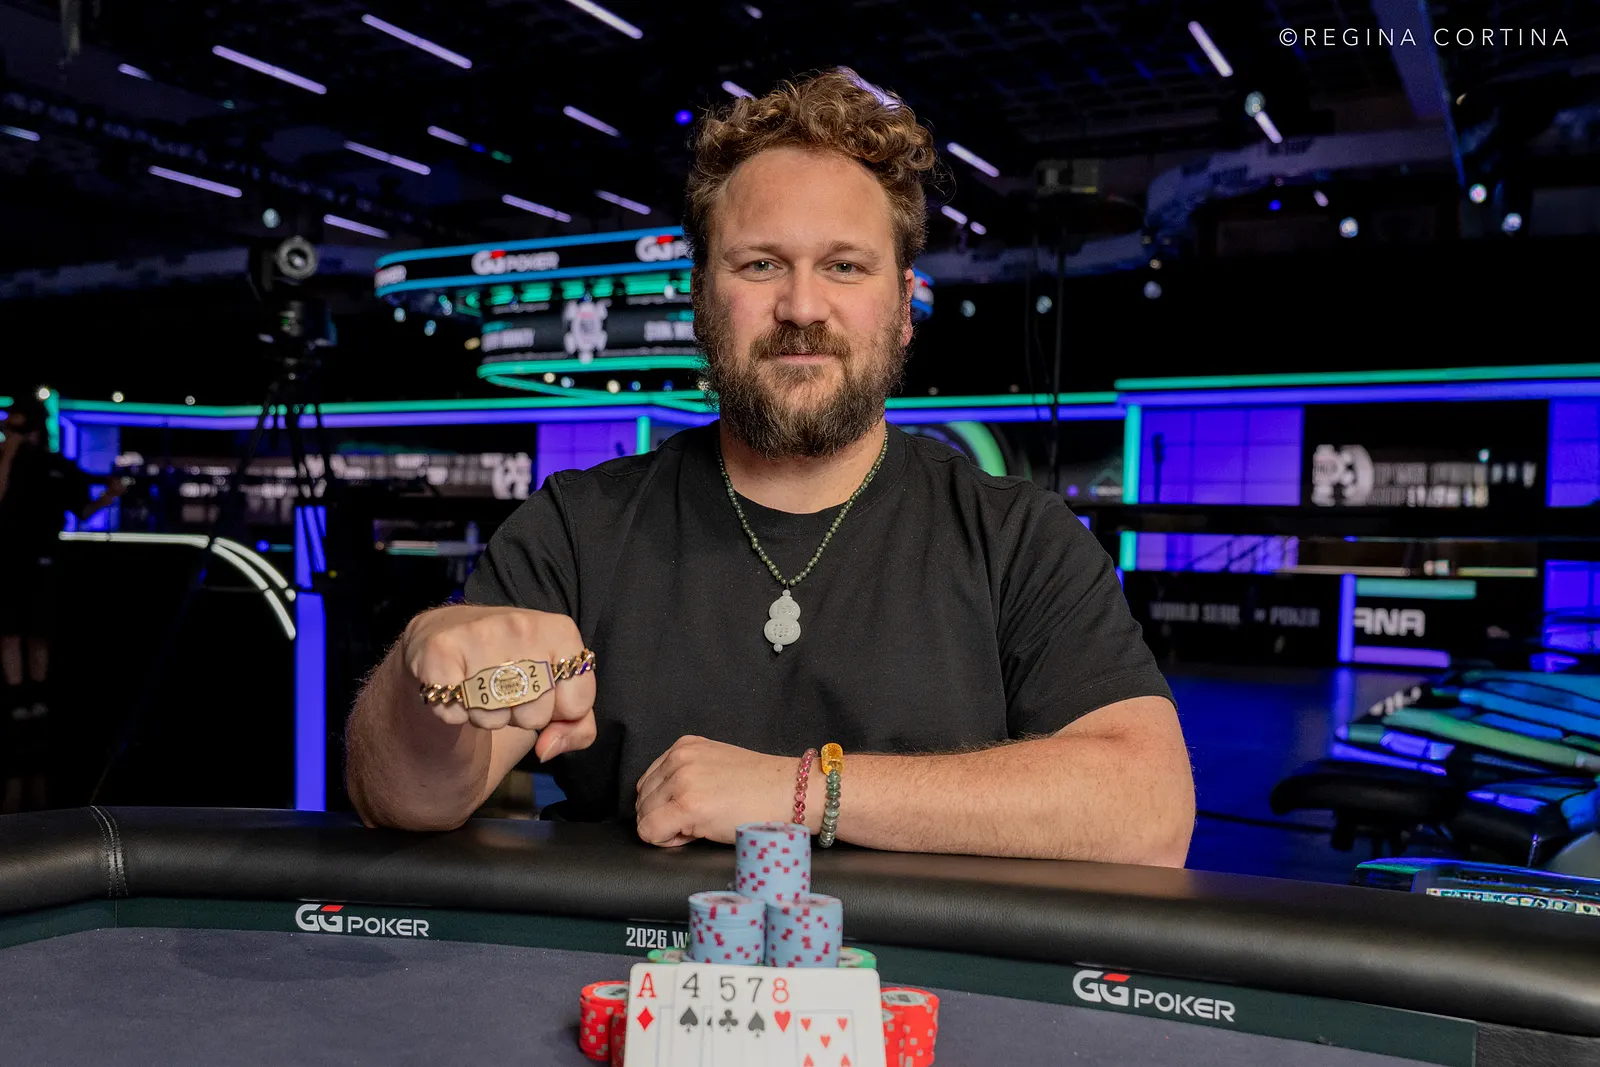
Calvin Anderson Wins $10K Razz Championship Again And Enters The Record Books
News
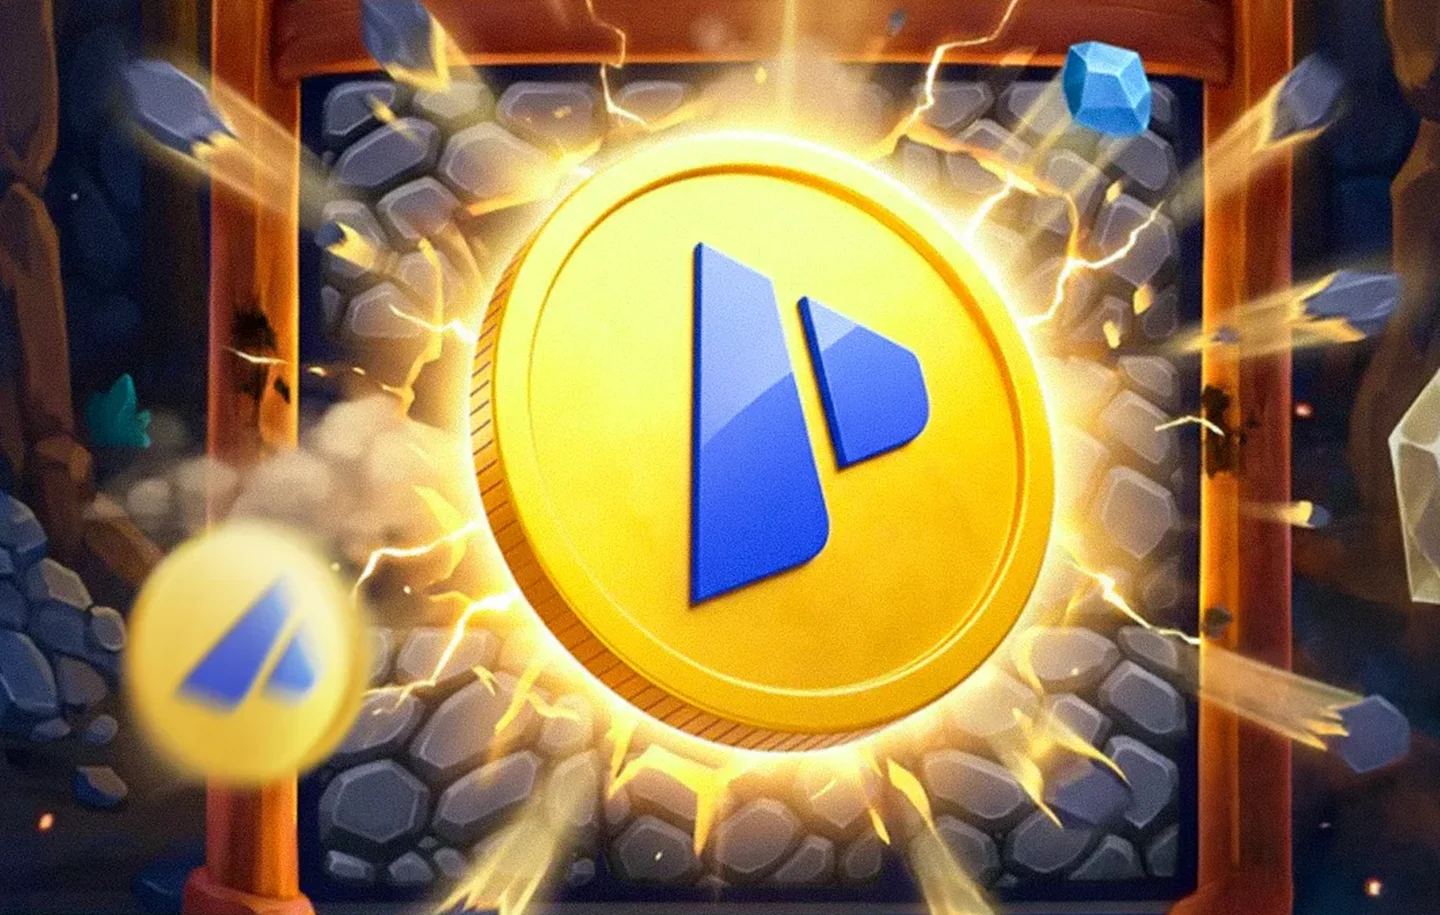
11:43, Jun 19
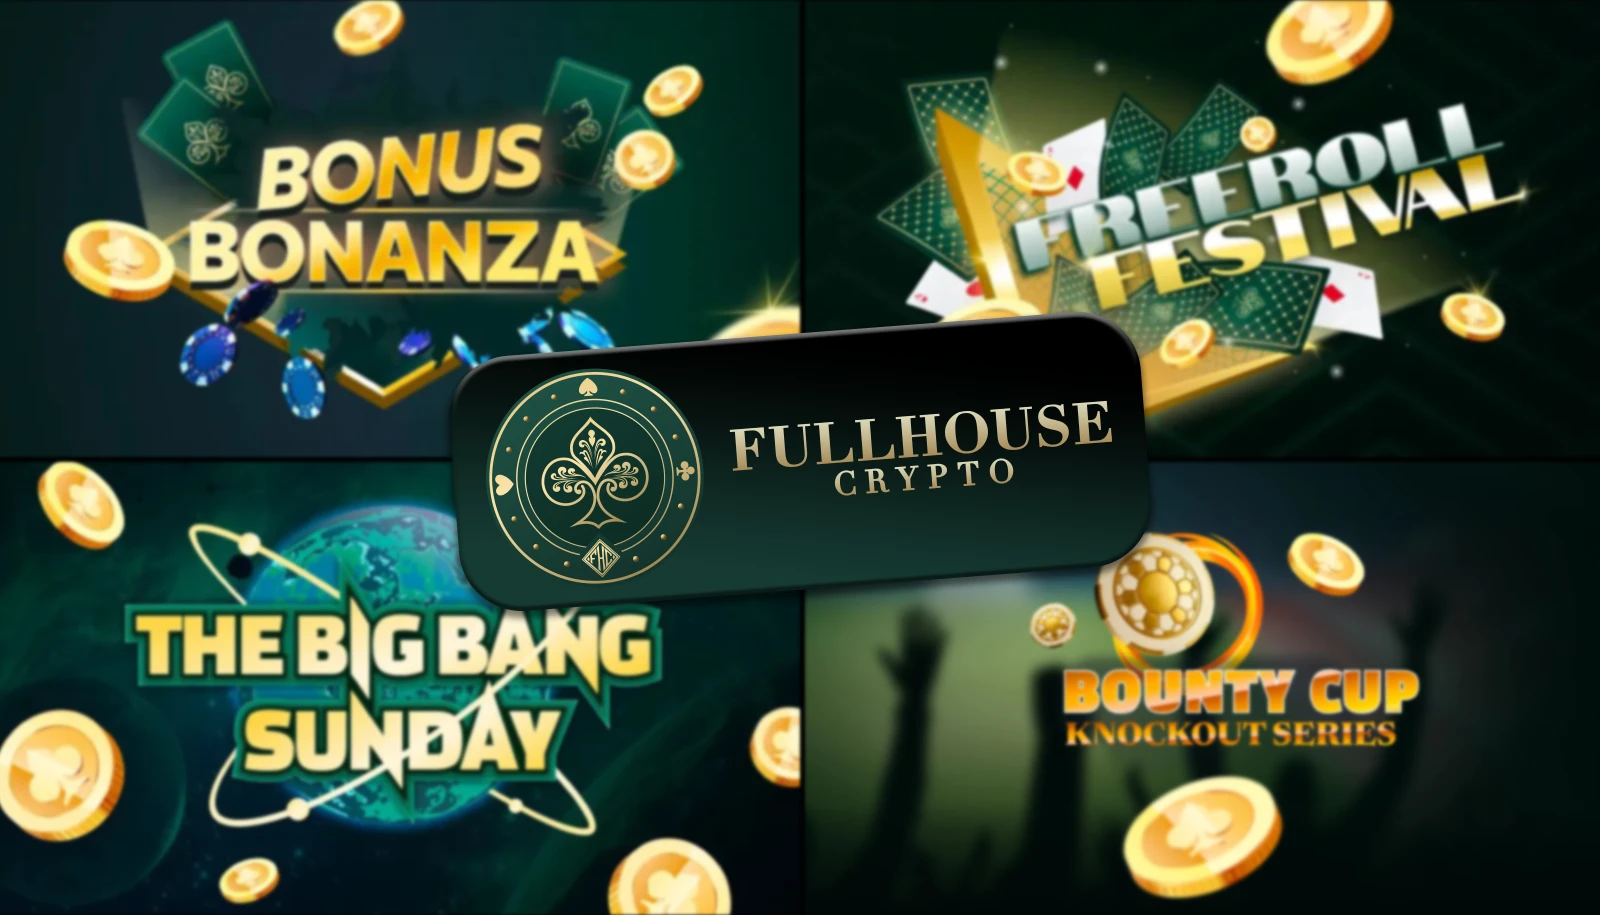
The Ultimate Tournament Guide to FullHouseCrypto This Summer
News
17:09, Jun 18
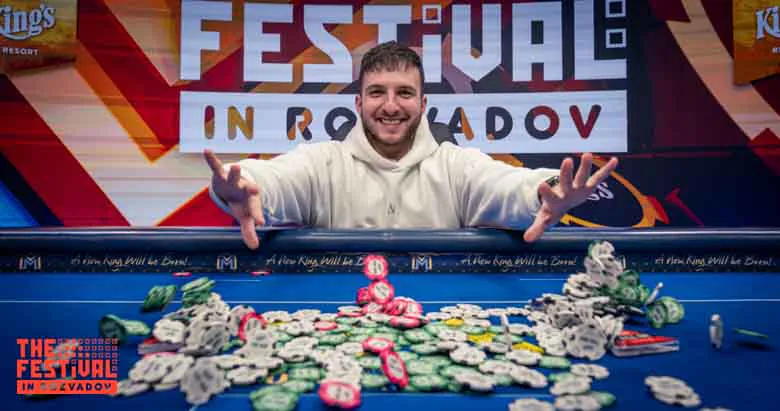
Craciunas Crushes Three Events, Voertmann Player of The Series and Much More From The Festival Rozvadov
News
14:19, Jun 18
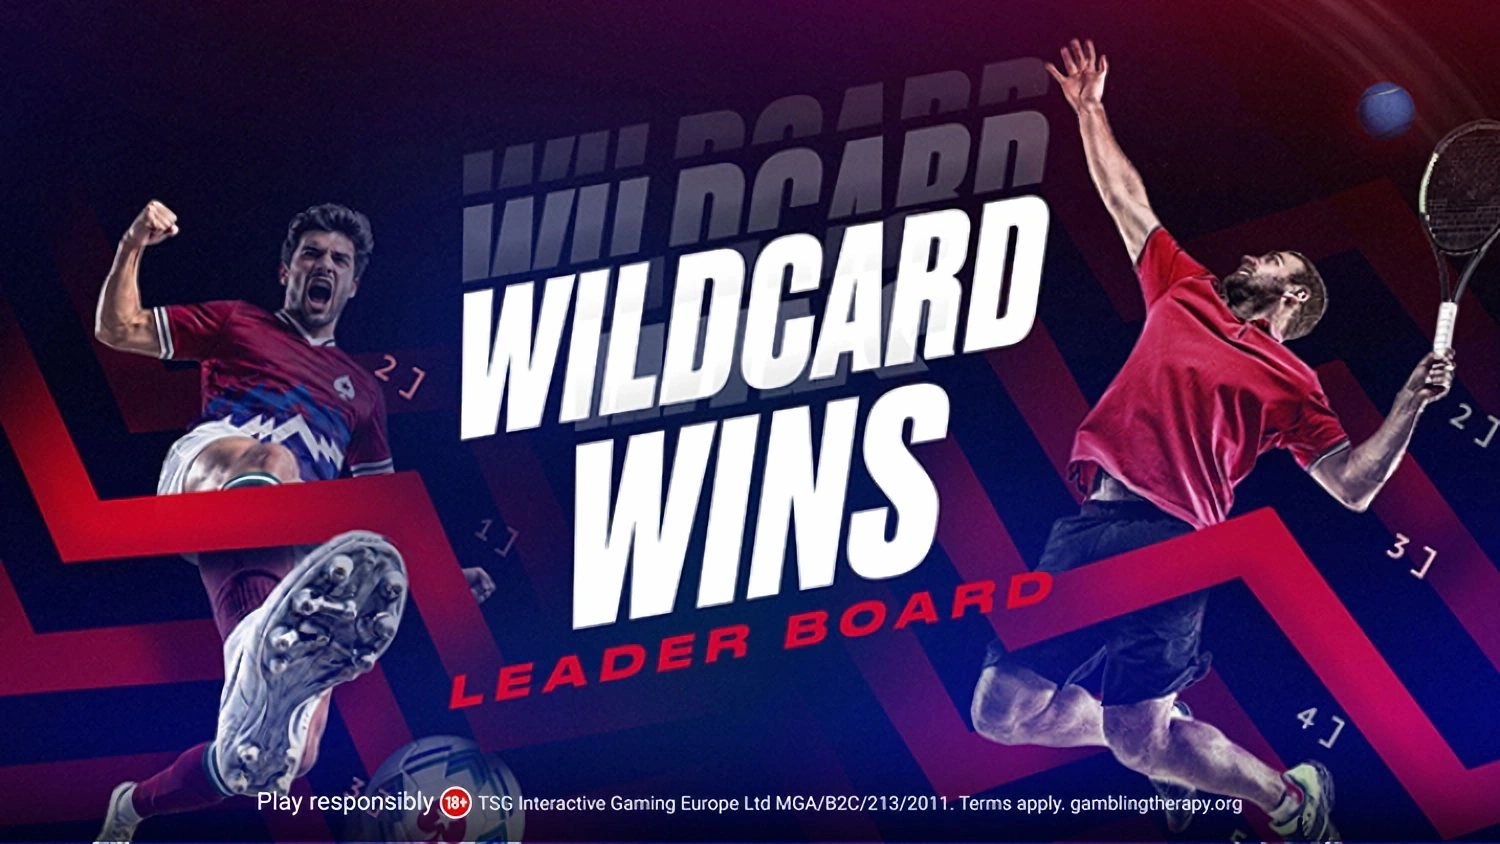
PokerStars Launches Wildcard Wins Leaderboard for the 2026 World Cup
News
13:18, Jun 17
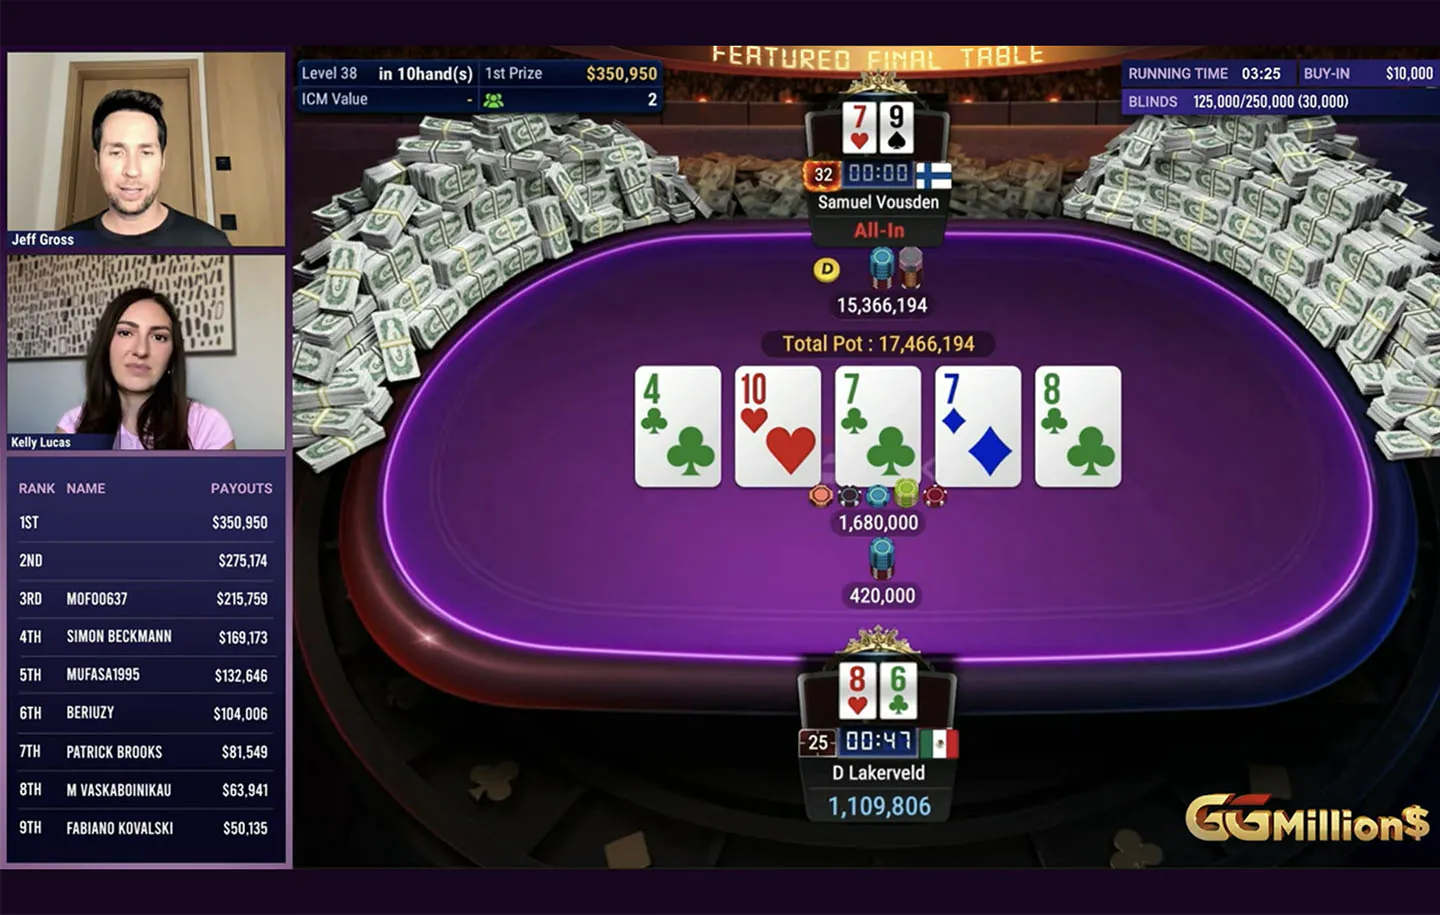
Samuel “€urop€an” Vousden Wins GGMillion$ Again And Sets An Unusual Record ($350,950)
News
13:44, Jun 18
888poker Happy Hour Makes Its June Return to Rakeback
News
15:42, Jun 16
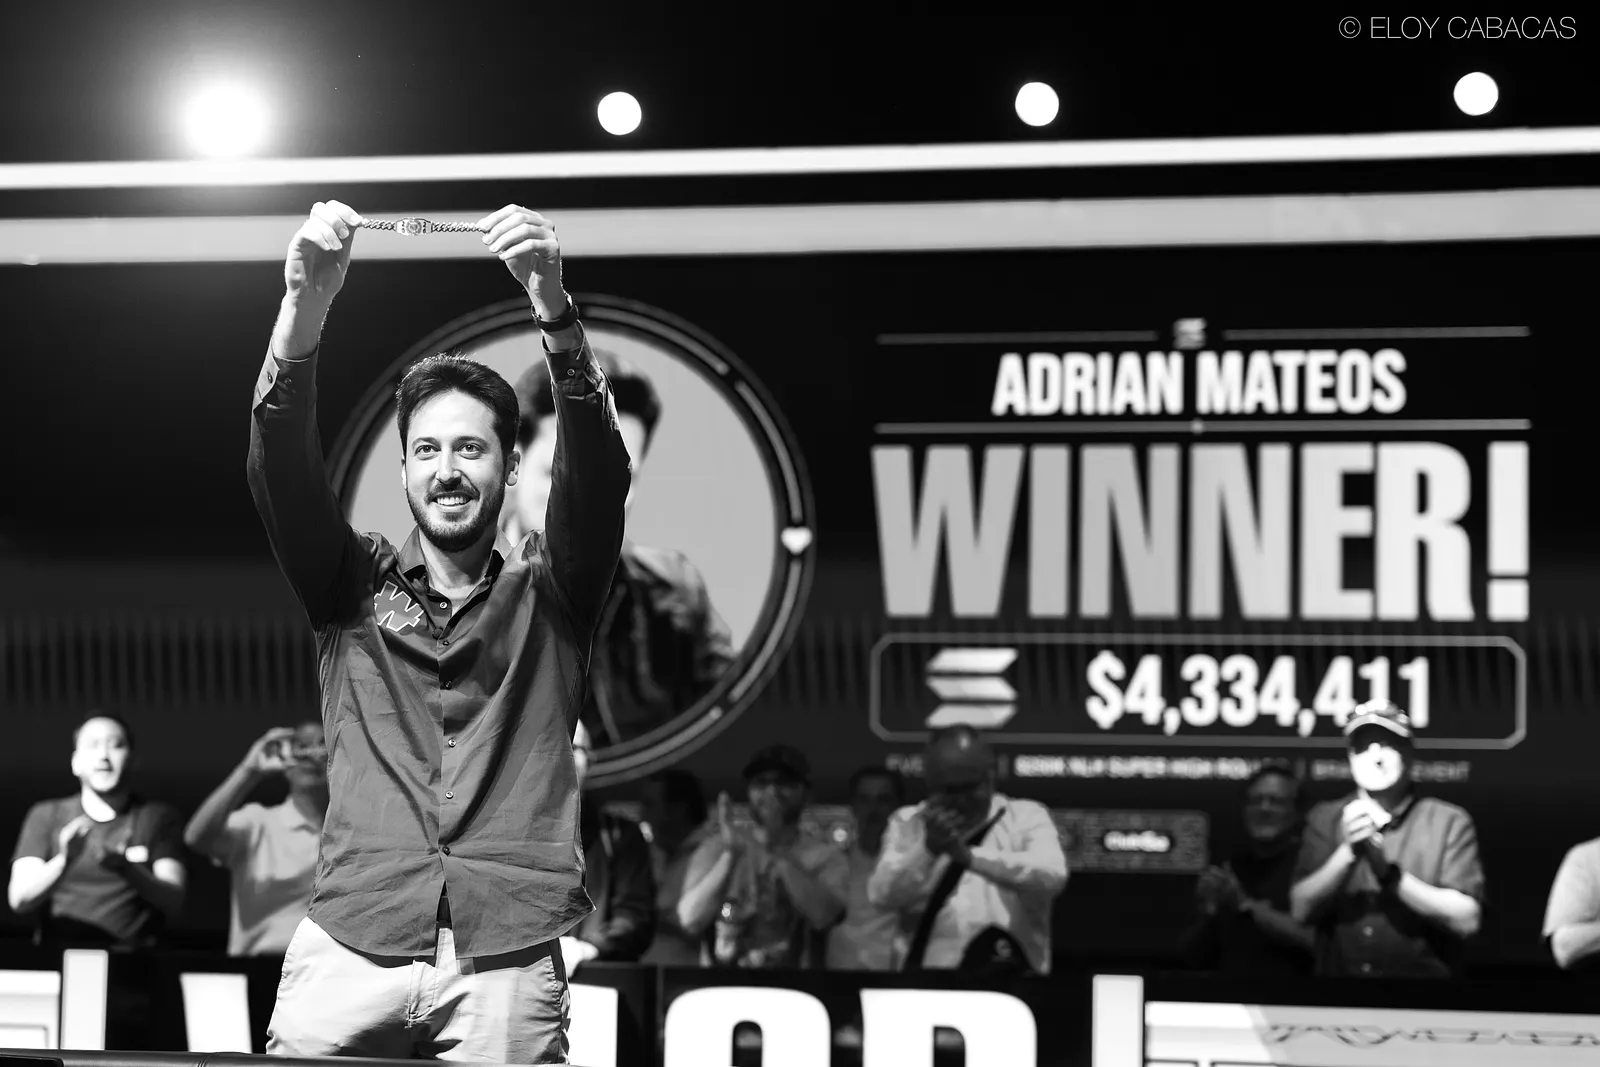
Adrian Mateos Wins His Sixth Bracelet In The $250K WSOP Super High Roller ($4.33M)

News
10:56, Jun 16
CoinPoker VIP Arena: High Stakes Meet High Standards
News
18:08, Jun 15
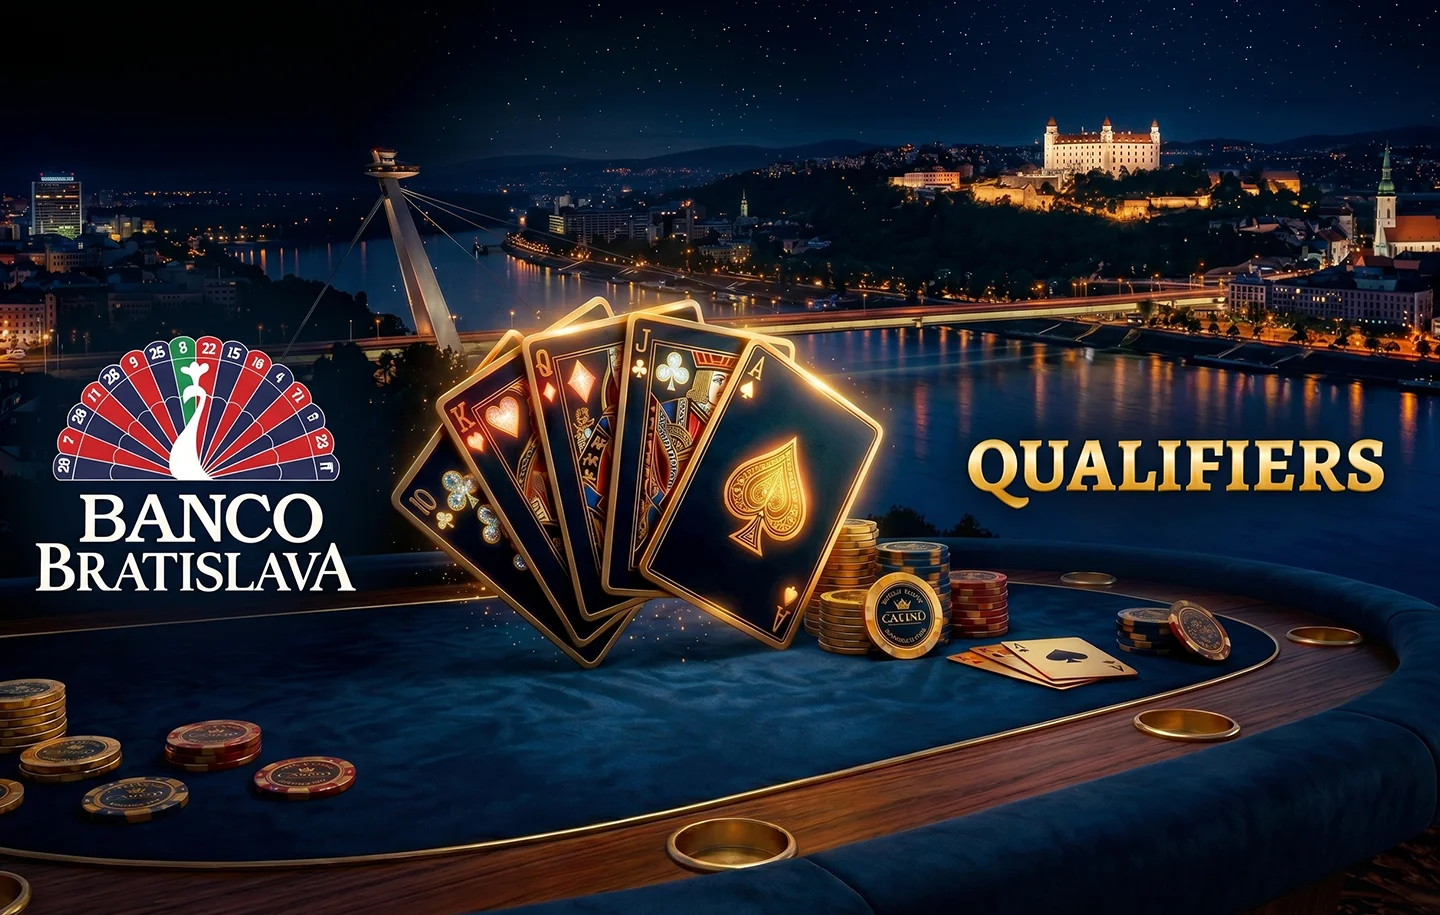
RedStar Poker Relaunches Banco Bratislava Satellites for the Rest of 2026
News
13:45, Jun 18
HUD Is Done: CoinPoker Updated Policies for Third-Party Tools & Software
News
13:43, Jun 18
888poker Welcomes Back the Global League This Summer
Casino News
14:54, Jun 15
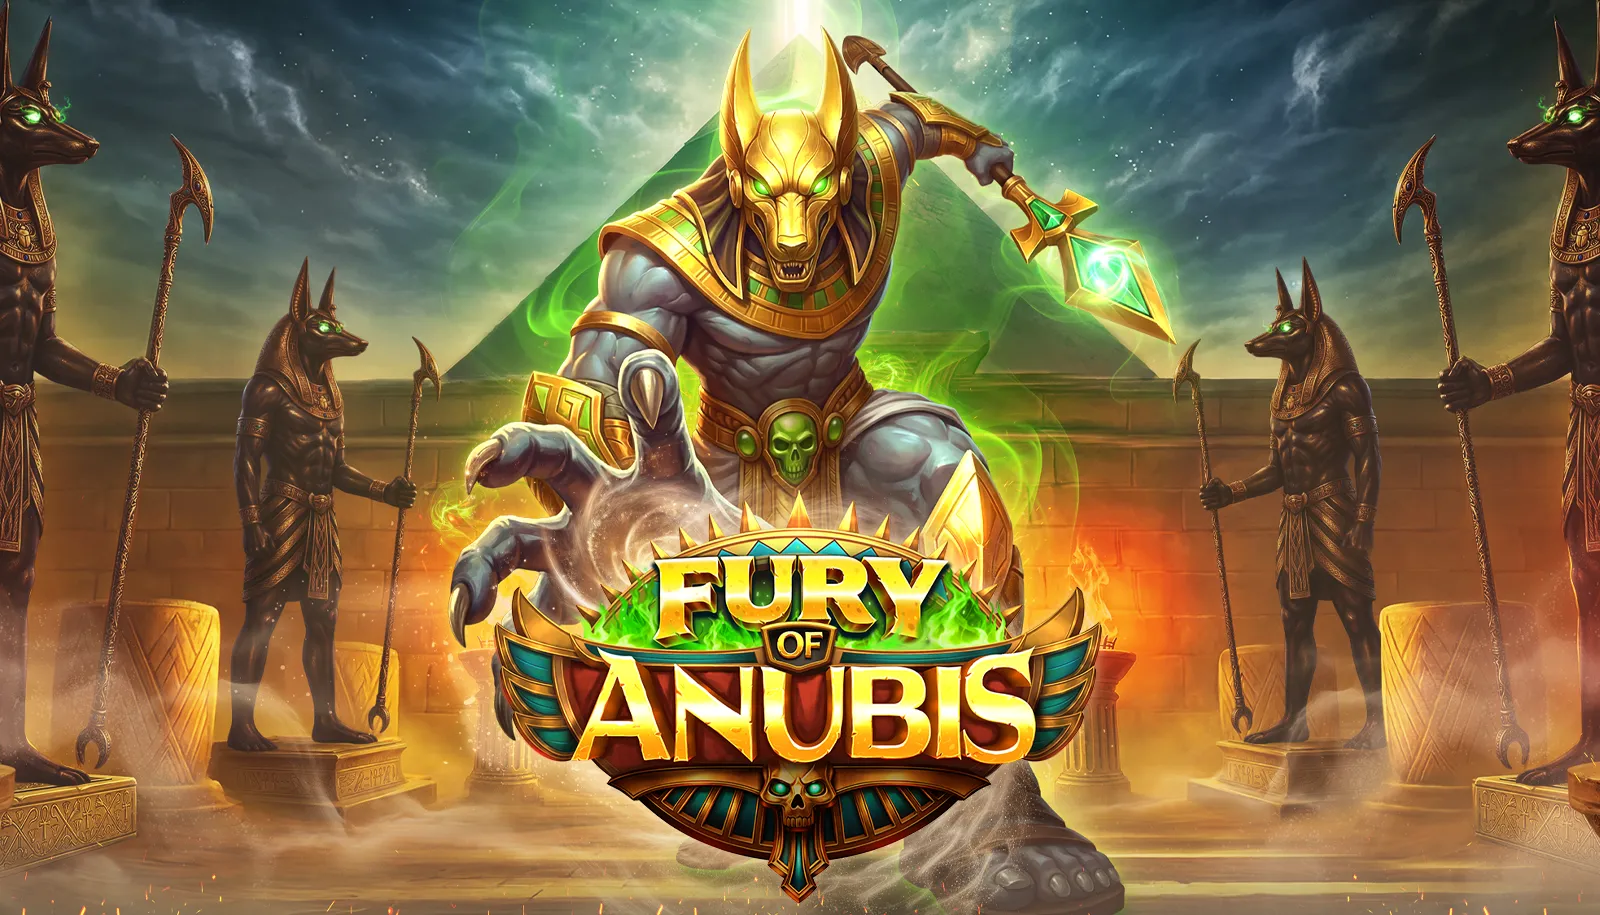
Pragmatic Play Launches Fury of Anubis with Multipliers up to ×1,024 and a Max Win of ×10,000!
News
13:46, Jun 15
Yuri Dzivielevski Continues His Upswing With A Victory In The $100K High Roller NLH ($2,841,432)

News
11:02, Jun 13
microFestival Returns to GGPoker!
News
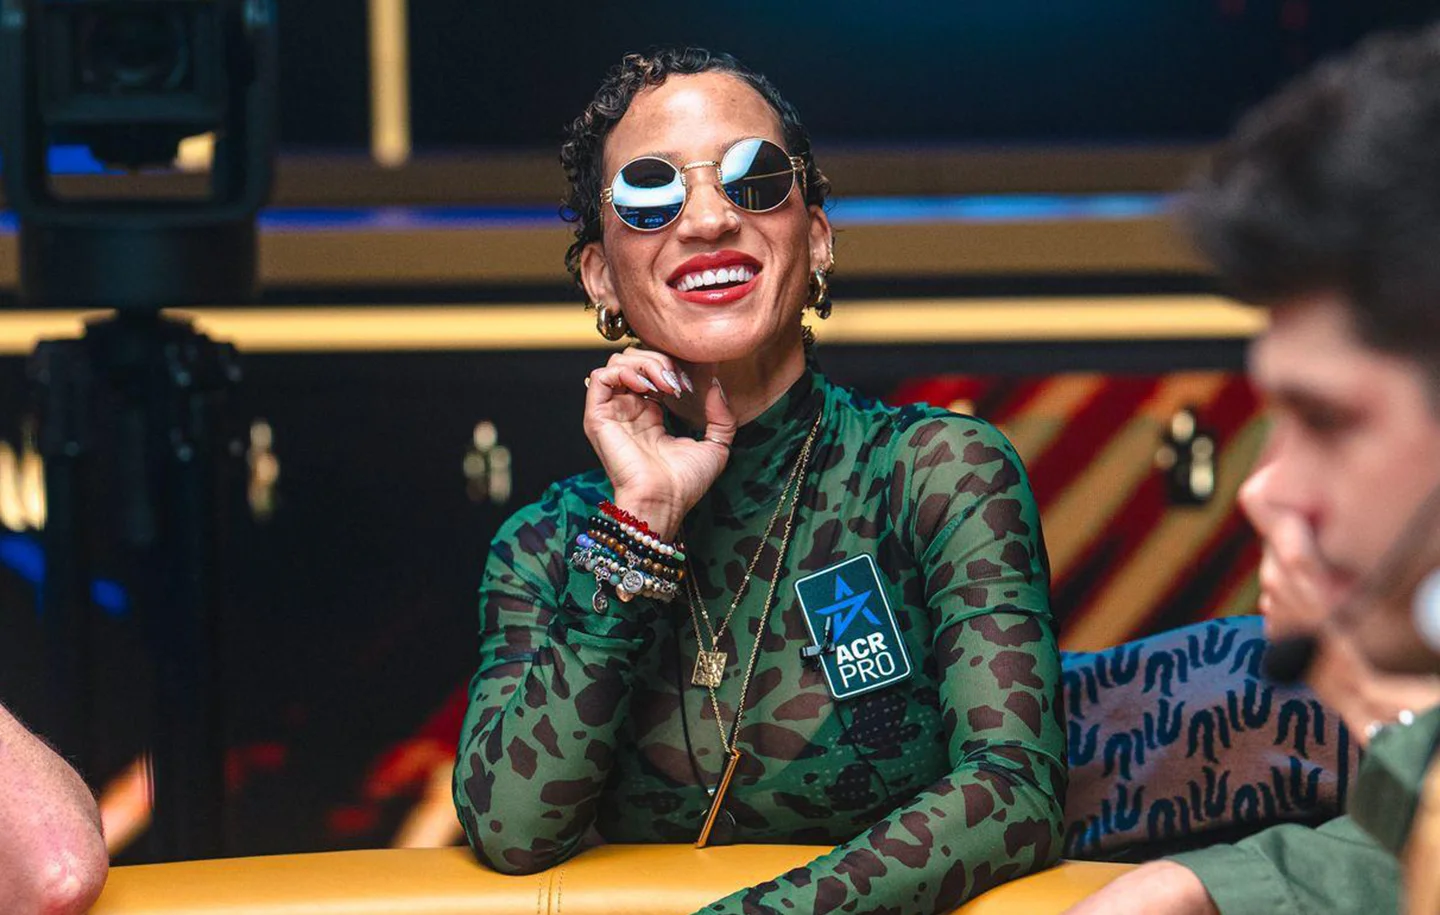
18:59, Jun 12
ACR Poker Has Officially Bid Farewell to Ebony Kenney
News
12:58, Jun 12
Peakbet Casino Bonus Guide: From the Welcome Match to Golden Nuggets and Pinata
News
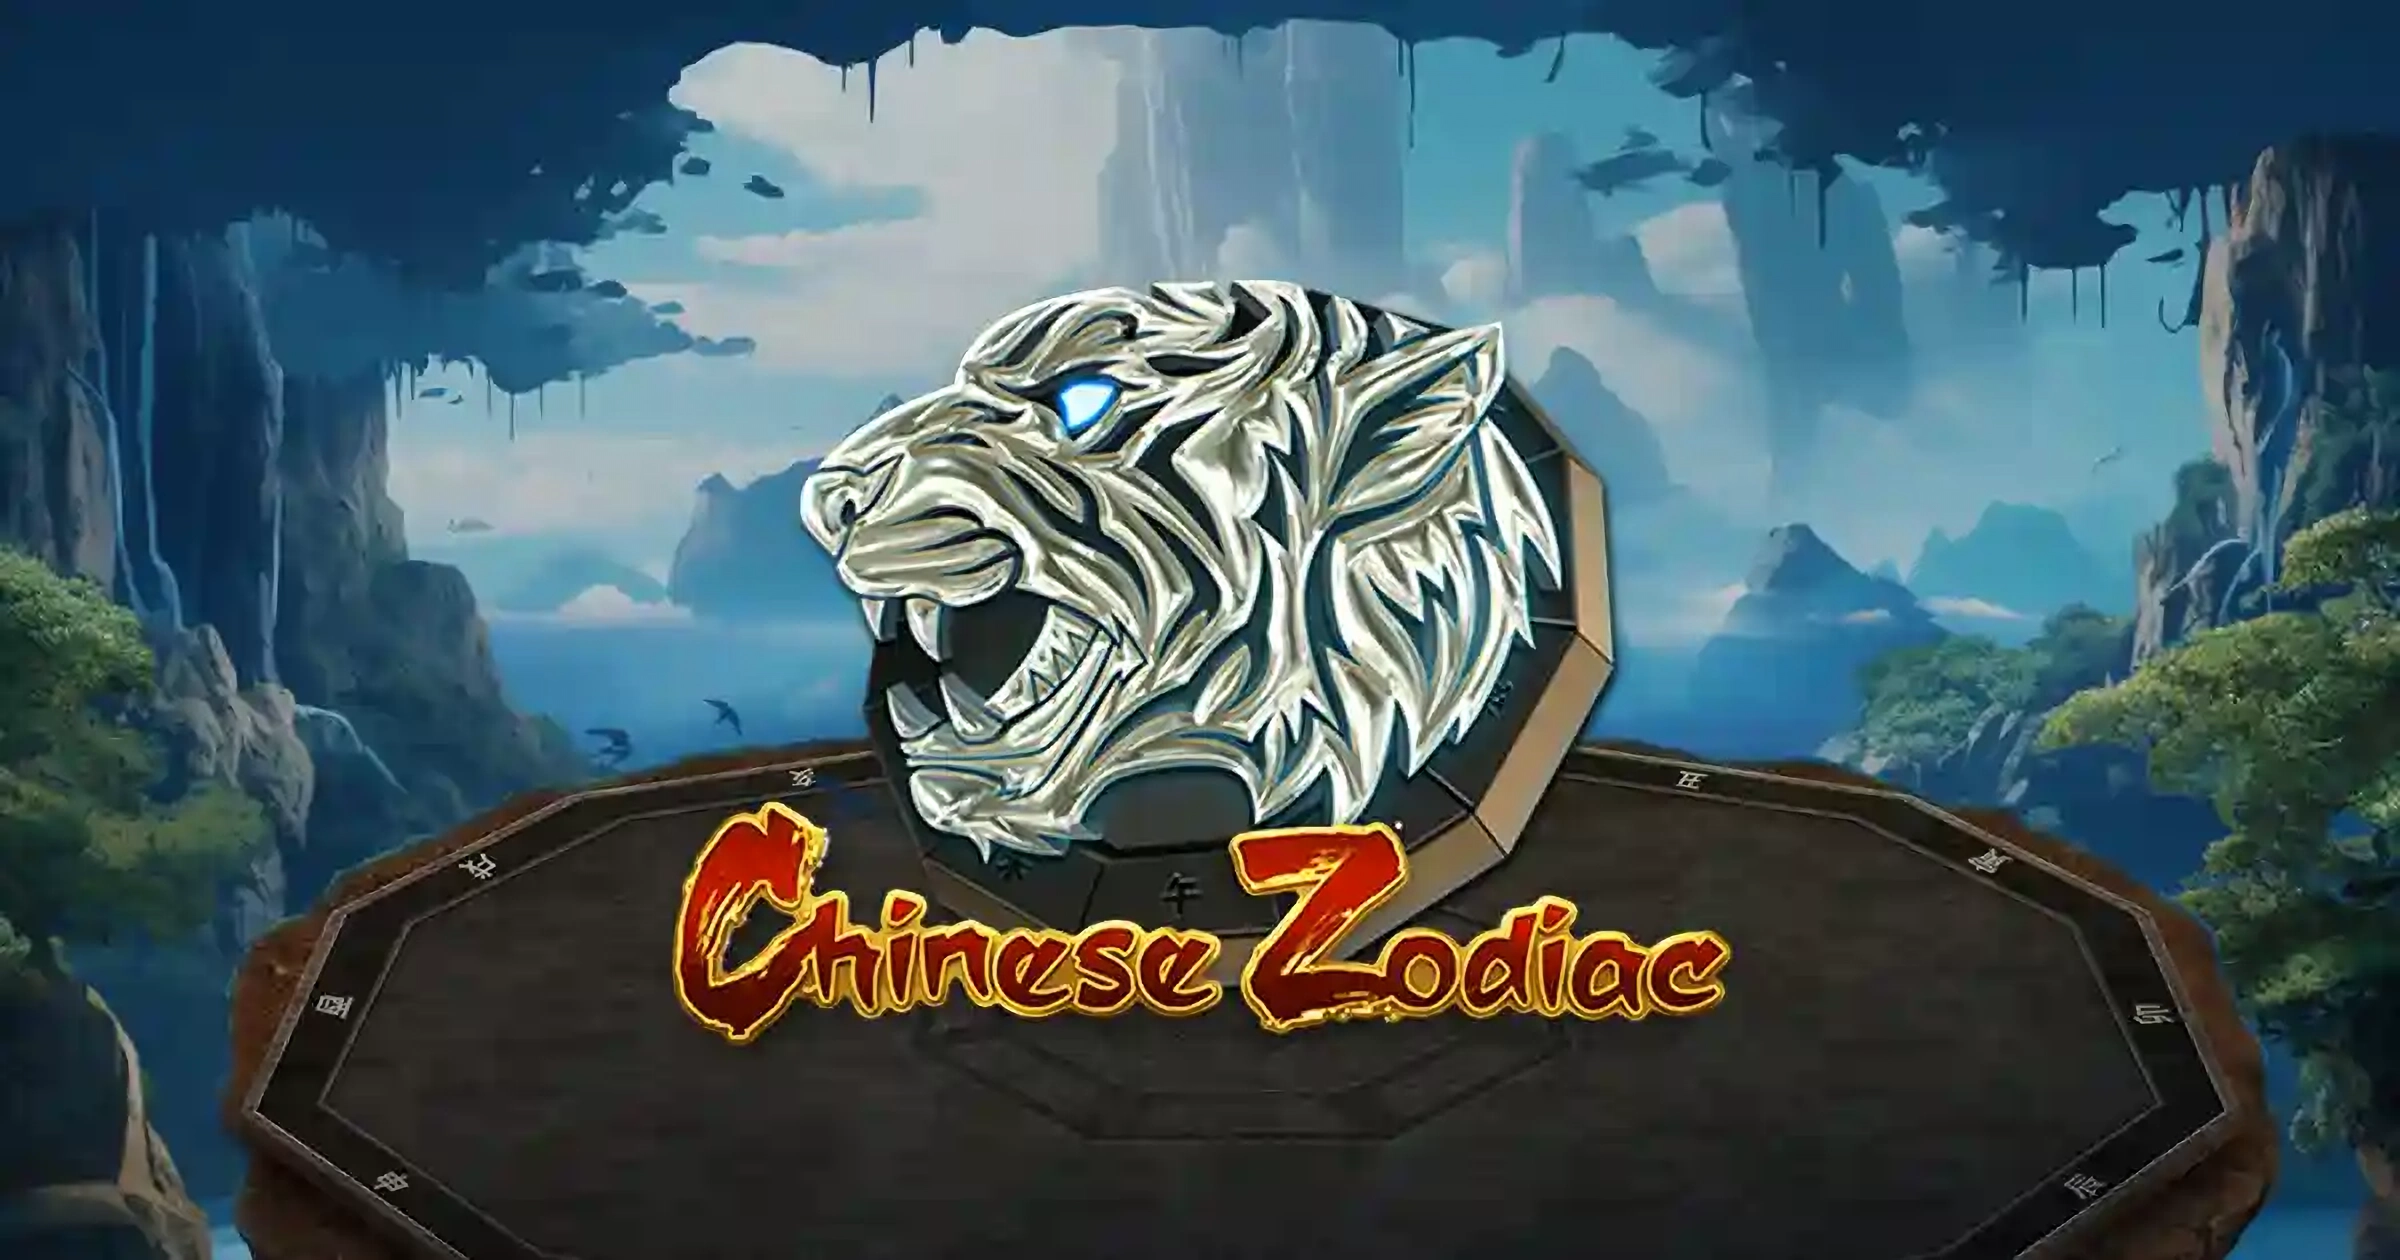
14:20, Jun 11
Zodiac Festival Brings GGPoker Players ¥100,000,000
News
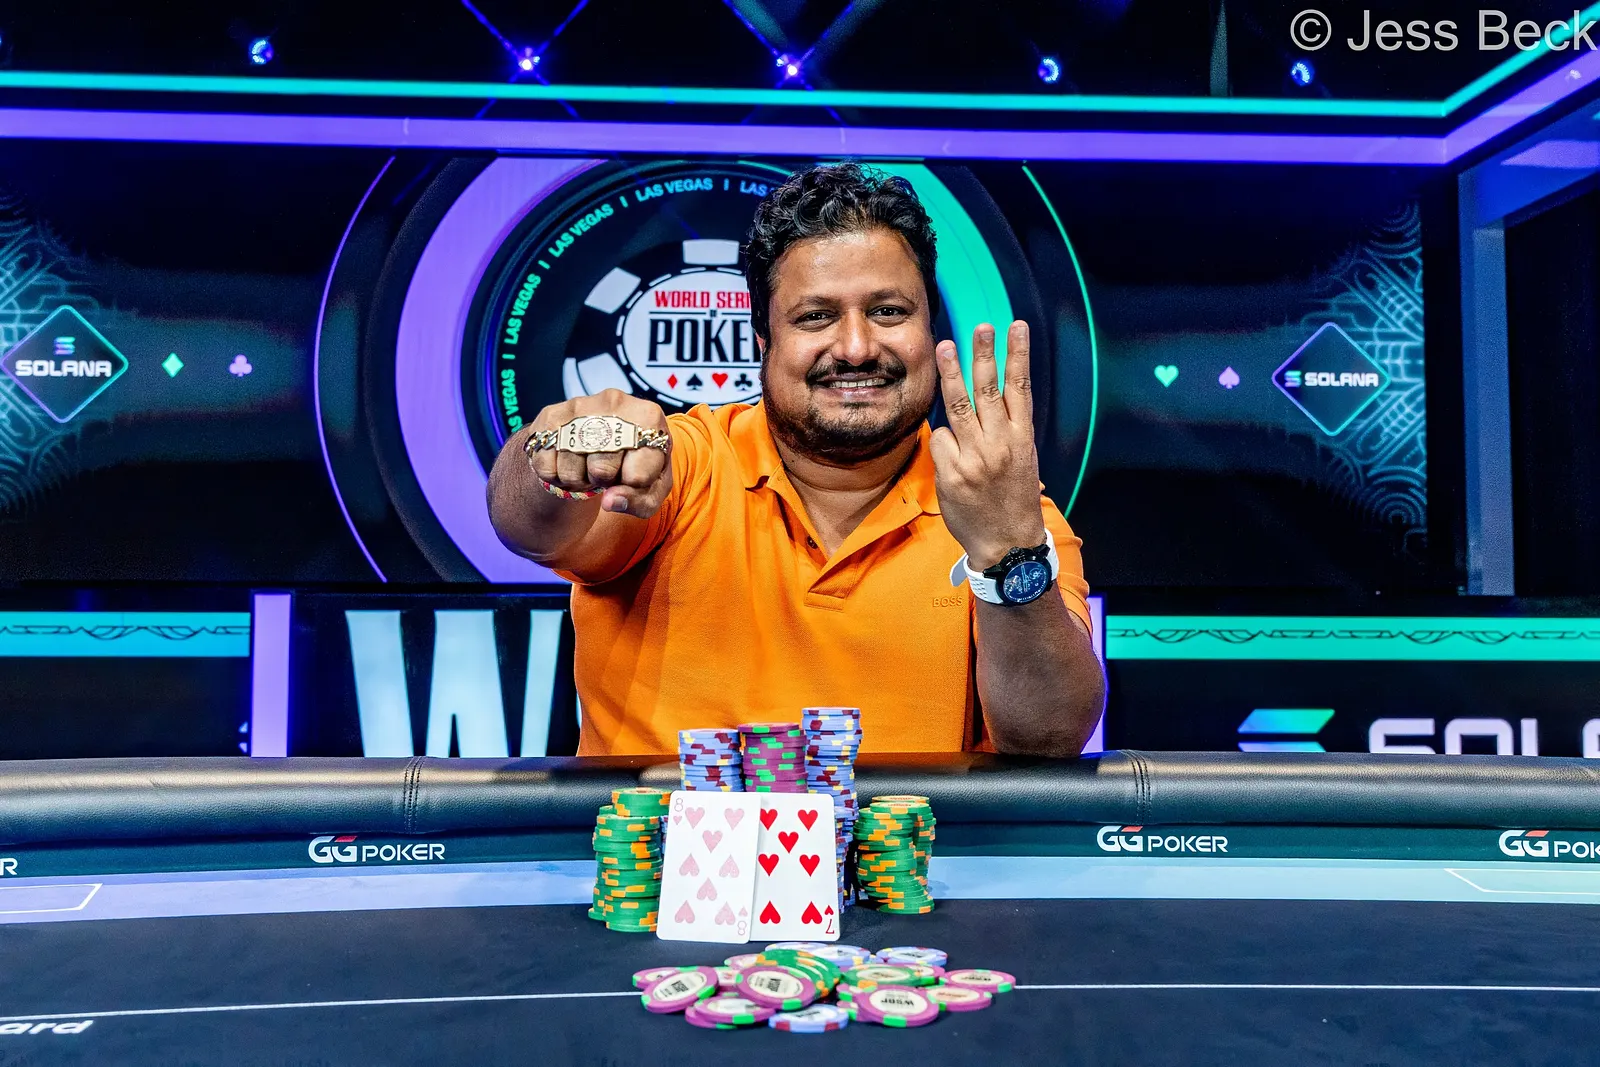
16:00, Jun 11
Santhosh Suvarna Wins Third WSOP Bracelet In $50K High Roller For $1,992,870
News
10:35, Jun 11
WSOP Welcomes Solana as Crypto Buy-Ins Make Their Vegas Debut
News
09:39, Jun 11
GGPoker Brings Back the $1M Go for Gold Promotion
News
14:11, Jun 12
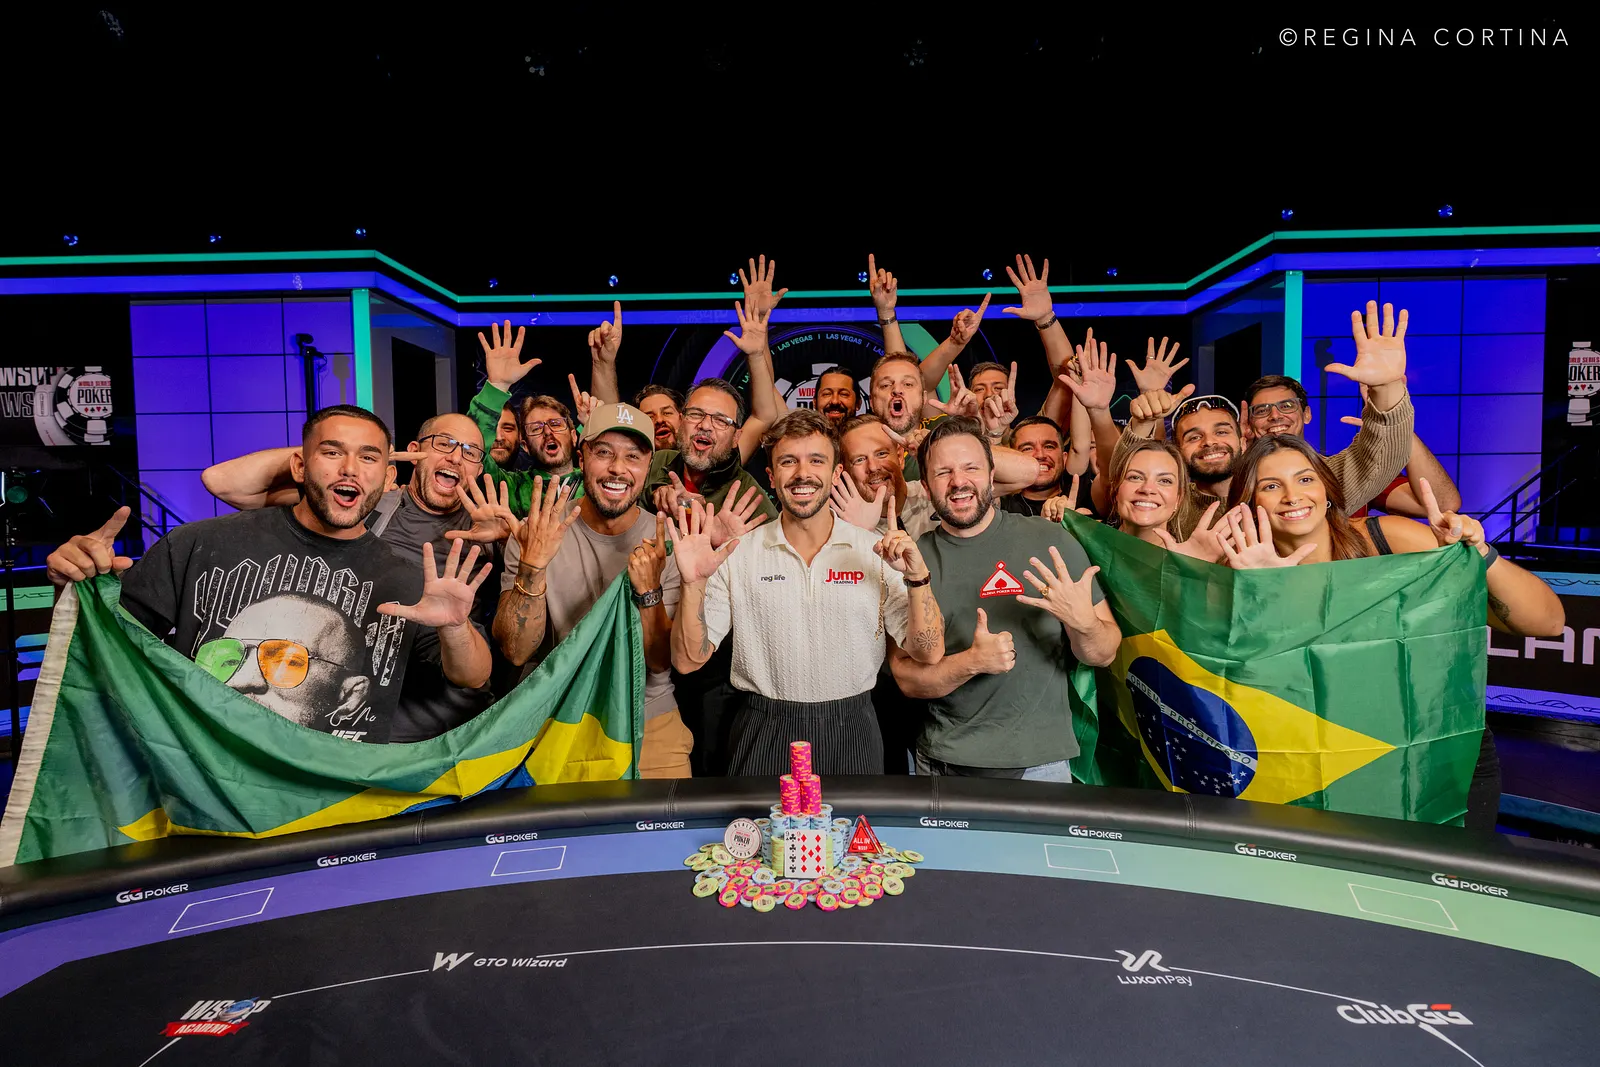
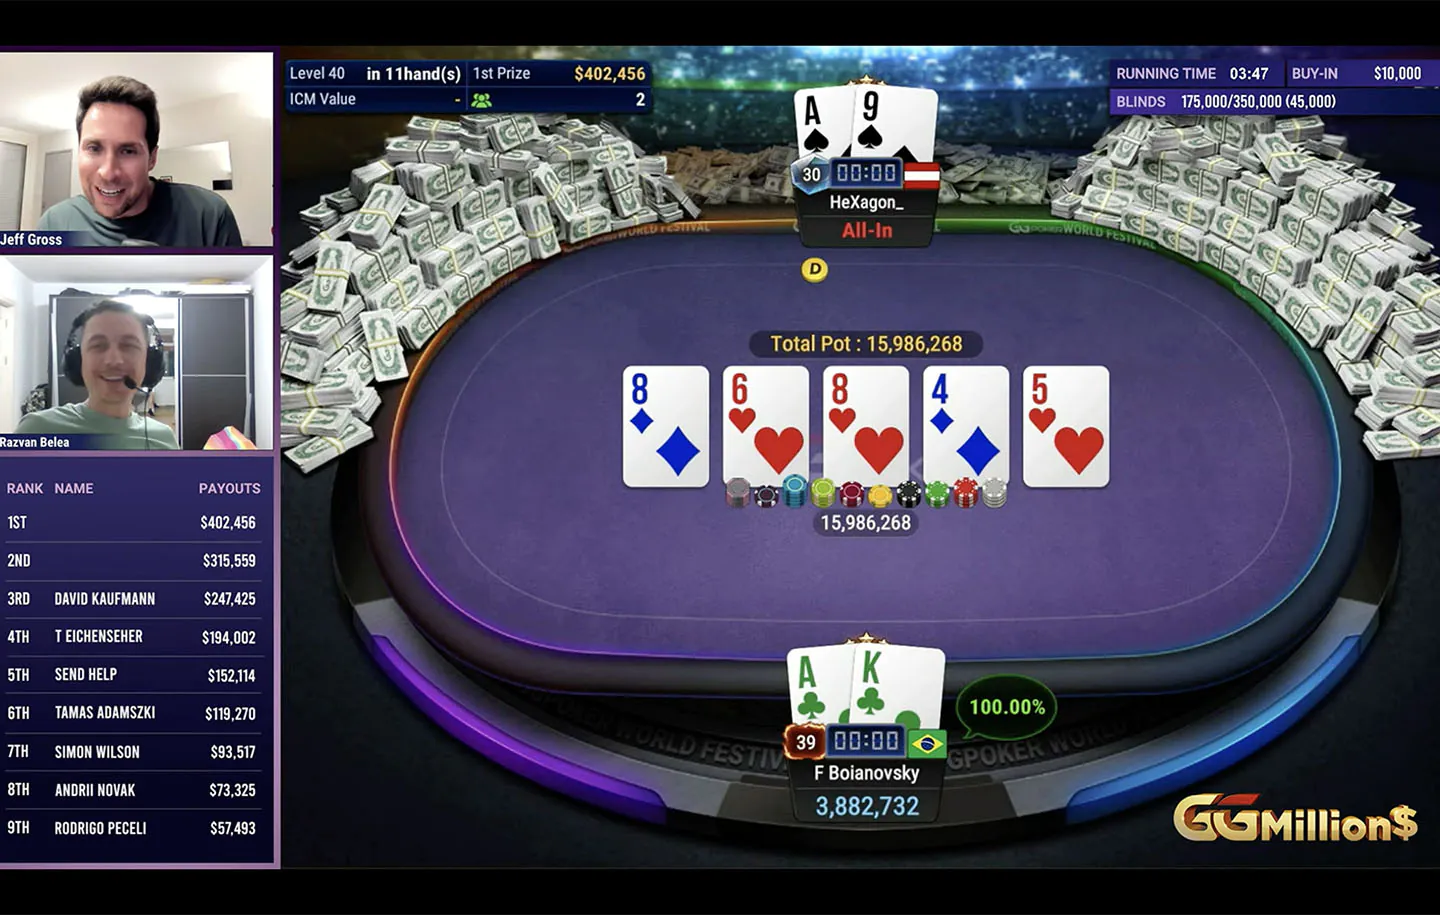
Felipe Boianovsky Wins His First GGMillion$ Title
News
17:29, Jun 09
Artur Martirosian Wins Fourth Career Bracelet In $25K WSOP High Roller 6-Handed ($1,286,285)
News
13:41, Jun 09
BCPoker World Cup Festival Turns World Cup Fever Into a Month of Poker
News
12:59, Jun 09
WSOP Partners With Warner Bros. Discovery Sports Europe
For nearly two decades PokerListings has been covering the biggest moments in poker – from the legendary WSOP 2006 in Las Vegas to the shock of Poker Black Friday in 2011 and the launch of the first fully legal US online poker room. Today, we continue that tradition with fresh daily updates, breaking news, tournament coverage, player stories, and expert insights that keep you connected to the fast-moving poker world.


