
 EN
EN  DE
DE Best Keno Numbers: Patterns, Odds, and Winning Myths Explained

 PokerListings
-
18+ | Play Responsibly | T&C Apply
-
 ChipnWIN Social Casino 15,000 GC + up to 100 SC
18+ | Play Responsibly | T&C Apply
-
 Stake.US Casino $25 Stake Cash + 250,000 GC
18+ | Play Responsibly | T&C Apply
-
 CrashDuel Casino 100% up to 200,000 GC + 50 SC
18+ | Play Responsibly | T&C Apply
-
 ZumbaCards Casino 5 Free Cards
21+ | Play Responsibly | T&C Apply


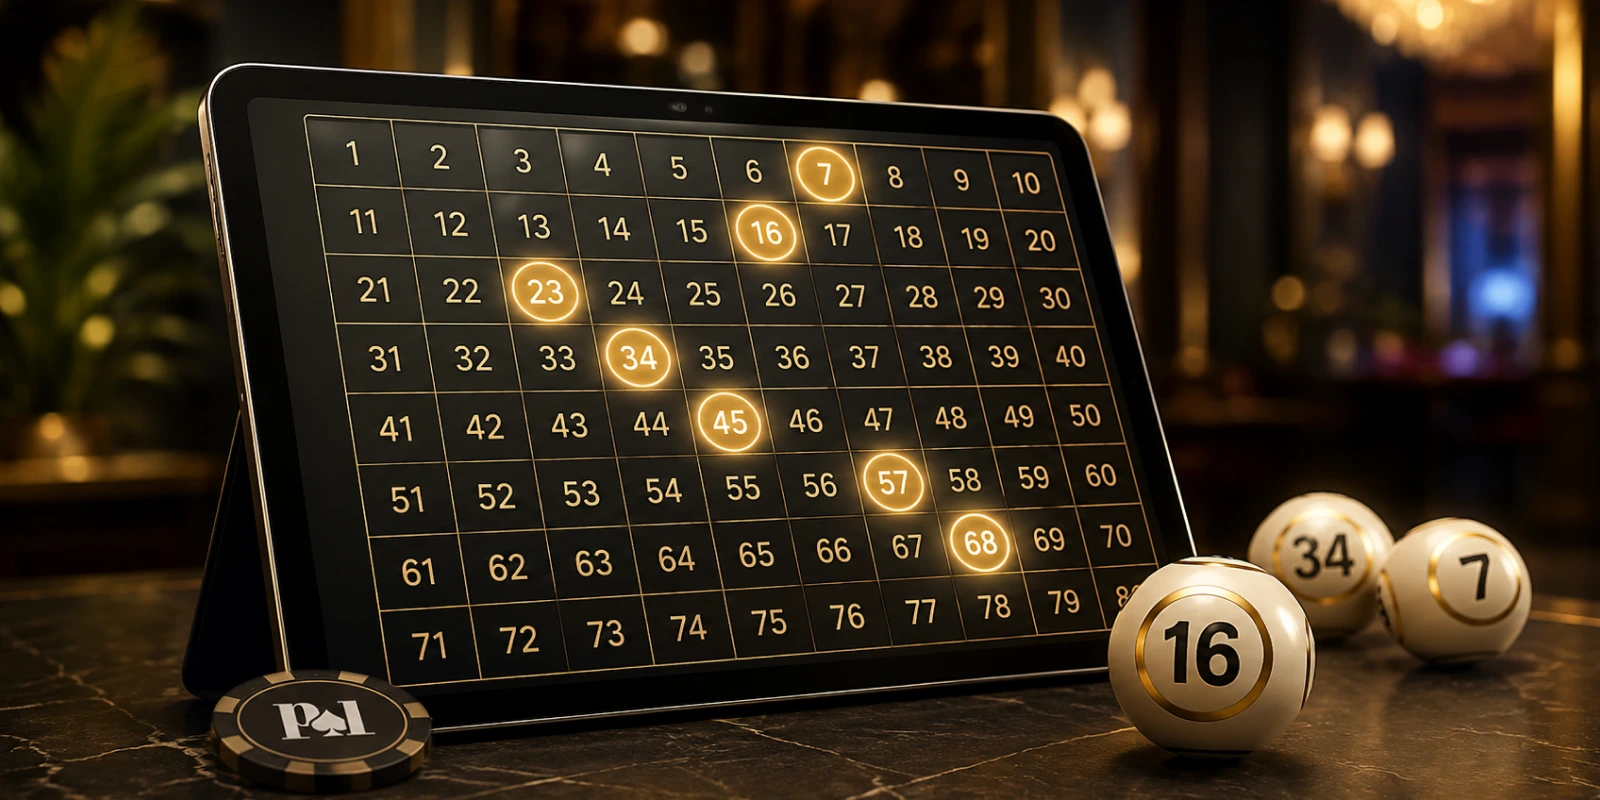
Keno stands as one of the most widely played lottery-style games across the United States. From state lottery terminals inside local venues to tribal casino floors and online platforms, the game draws millions of US players who track numbers and test strategic combinations daily. The draw speed and round frequency naturally prompt players to search for secret patterns, optimal cluster shapes, and winning number formulas.
Despite its visual simplicity, Keno operates on a strict mechanical truth: every single number carries the exact same statistical weight before a round begins. Online operators rely on certified Random Number Generation (RNG) algorithms that select 20 numbers from an 80-ball pool with no memory of prior outcomes. Physical ball machines in land-based casinos follow the identical mathematical probability.
With 20 numbers drawn from 80 each turn, the total number of unique card combinations equals roughly 3.5 quintillion (a 35 followed by 17 zeros). Probability governs this process completely, giving every individual number an identical 25% chance of appearing on any single 20-ball draw.
Understanding Keno Odds and Probability
Evaluating Keno performance requires breaking down the core math governing the game grid. Unlike blackjack or poker, where player decisions alter the remaining card deck, Keno odds remain fixed across every single draw.
| Metric | Statistical Value |
|---|---|
| Total Number Pool | 80 numbers |
| Numbers Drawn Per Round | 20 balls |
| Single Number Drawing Odds | 1 in 4 (25% probability) |
| Total Possible Combinations | 3,535,316,142,212,174,320 |
| Average Casino House Edge | 20% to 35% |
Software providers engineer certified RNG systems specifically to guarantee that historical sequences cannot alter future draws. The built-in house edge stays constant regardless of the numbers chosen on a ticket.
Myths About Predicting Winning Numbers
Search online forums or player communities and specific digits surface repeatedly: 1, 4, 12, 23, 27, 34, 35, 50, 65, and 72. Many players treat these lists as proven picks. Statistically, every number on the card shares the exact same drawing probability on every new round.
Believing a specific digit is overdue relies on the Gambler’s Fallacy: the mistaken assumption that past random outcomes dictate future results. Players typically divide numbers into two artificial categories:
- Hot Numbers: Digits drawn frequently during recent local sessions.
- Cold Numbers: Digits absent from recent draw histories.
Neither category holds predictive power. A number drawn five times in ten rounds maintains the same 25% chance on the next spin as a number absent for fifty rounds. Numerology (selecting numbers based on birthdays, anniversaries, or lucky dates) functions purely as a personal ritual without altering ticket math.
Tracking any chosen digit across 50 independent draws yields an average appearance rate of 12 to 13 hits, matching every other number on the grid.
Keno Number Selection Strategies Compared
Because RNG systems make every number equally likely, player strategies focus on organizing gameplay rather than predicting winning combinations. Three primary selection approaches dominate the game:
1. Hot Numbers Strategy
Players track digits that appeared frequently in recent rounds using printed casino sheets or digital logs. However, comparing official lottery feeds and draw analyses on specialized platforms highlights the flaws in this approach. German Keno, Washington Lottery Keno, and Michigan Lottery Keno each publish “most frequent” number lists that rarely overlap. If hot numbers reflected a systemic pattern, properly randomized draws would converge on identical digits. They do not, because each platform runs an independent RNG.
2. Cold Numbers Strategy
This approach targets digits absent from recent draws under the assumption that probability will force a corrective hit. Coin flips offer a direct parallel: after nine consecutive tails, the tenth flip still maintains a 50/50 probability because the coin holds no memory. Keno numbers behave identically. A digit absent for 30 consecutive rounds carries the exact same 25% drawing probability on the next turn as a digit that landed in the previous round.
3. Quick Pick Strategy
Quick Pick allows the software to generate numbers automatically. Because every number holds identical odds, automated selection delivers the exact same mathematical expectations as hand-picked combinations while eliminating manual selection fatigue and speeding up session pacing.
Most Common Winning Patterns in Keno
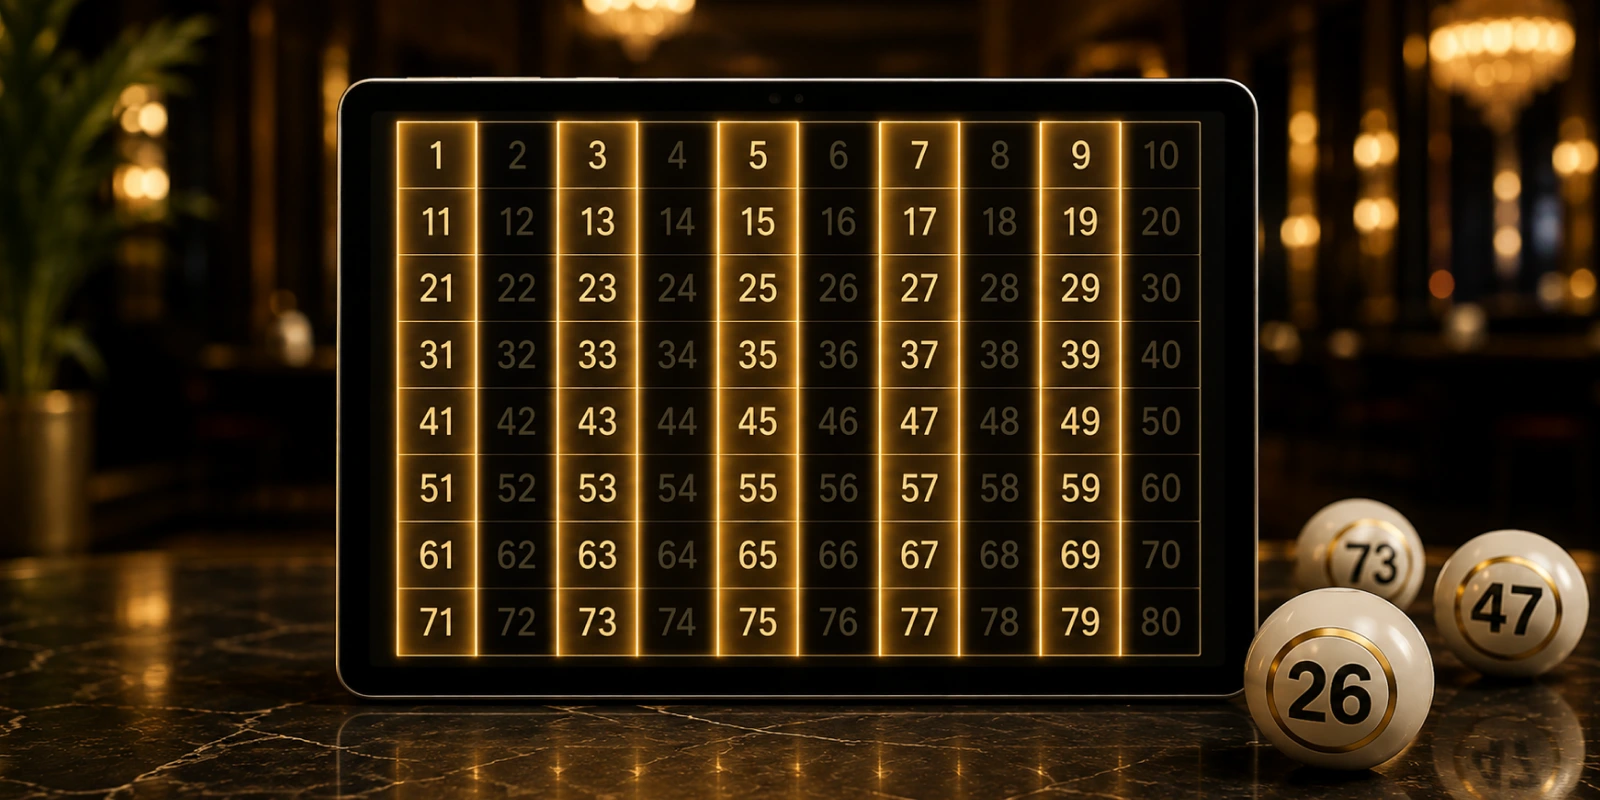
Many experienced players prefer selecting numbers using visual grid patterns rather than isolated digits. While geometric arrangements make card filling organized, understanding their true impact helps set realistic expectations.
Number Clusters Explained
Number clustering involves selecting adjacent digits on the betting card, such as 12-13-14-15 or tight 2×2 blocks like 21-22-31-32. Players choose clusters hoping the draw mechanism hits localized sections of the board. Because RNG algorithms select numbers uniformly across the full 80-ball field, a consecutive 4-number cluster holds the exact same hit probability as four widely scattered digits across the grid corners.
Popular Visual Patterns
- The Edge & Corner Bet: Selecting numbers along the outer boundaries or the four extreme corners of the ticket layout.
- The Diamond or Bullseye: Filling a central diamond shape on the grid card.
- Row and Column Sweeps: Marking complete horizontal lines or vertical columns.
How to Choose Winning Keno Patterns
Choosing visual patterns offers an engaging way to structure tickets without getting bogged down in manual decision fatigue. Using a visual pattern does not tilt the house edge, but it helps players track their tickets visually as numbers land on screen.
Factors Affecting Keno Number Frequency
While every number carries identical theoretical odds, several operational factors influence how frequency lists appear across different platforms:
- RNG Certification vs. Physical Machines: Online casinos rely on digital RNG engines audited by independent laboratories. Physical casino venues use air-mix ball draw machines, which are subject to mechanical maintenance and weight verification standards.
- Platform Variance: Comparing state lottery draw logs highlights how frequency lists shift by provider. Different software vendors generate distinct short-term frequency logs.
- Sample Size Noise: Short-term tracking logs (such as 50 or 100 draws) show temporary statistical spikes where certain numbers appear frequently. This represents natural variance rather than a permanent trend.
Expected Payouts for Keno Number Combinations
The primary strategic decision in Keno centers on spot count (the total number of spots selected per ticket, typically ranging from 1 to 10). Spot count dictates variance, hit frequency, and payout scale far more than individual number choices.
| Spot Count | Typical Hits Needed for Payout | Volatility Level | Best Suited For |
|---|---|---|---|
| 1 to 3 Spots | 1 to 2 matches | Low | Frequent small returns; low balance swings |
| 4 to 6 Spots | 2 to 4 matches | Moderate | Balanced gameplay; moderate payout multipliers |
| 7 to 10 Spots | 5 to 10 matches | Extremely High | Jackpot chasing; long stretches without payouts |
Reviewing official paytables and state lottery guides on platforms like PlayPennsylvania allows players to match their spot count selection directly to their personal session budget. Playing 4 to 6 spots offers a practical middle ground for balancing hit frequency against potential returns.
Tracking Tools and Bankroll Management
Apps, spreadsheets, and frequency charts log historical draws in real time. However, tracking tools carry a built-in limitation: data remains variant-specific. A frequency chart constructed from one online provider does not apply to a different software vendor or a physical casino draw.
Effective Keno play relies on structured bankroll controls rather than number tracking:
- Establish Session Limits: Set a fixed loss limit prior to purchasing tickets and stop playing once that threshold is reached.
- Divide Total Funds: Split your total bankroll into smaller session allocations to absorb natural losing streaks.
- Match Spot Counts to Budget: Use lower spot counts during smaller bankroll sessions to extend playtime.
- Treat Draws as Independent Events: Avoid increasing wager sizes to chase losses after a cold streak.
Tips for Responsible Keno Play
Effective Keno management focuses on bankroll discipline rather than pattern tracking. Establishing clear personal guidelines before you start playing ensures that the game remains an enjoyable form of entertainment without placing unnecessary strain on your finances:
Establish a fixed limit prior to buying tickets and stop playing once that balance is reached.
Split total funds into smaller portions to absorb natural losing streaks across fast-drawing rounds.
Use lower spot counts during smaller sessions to extend total play time.
Avoid increasing wager amounts to chase losses after a series of missed tickets.
Frequently Asked Questions
What Is the Most Profitable Keno Strategy?
No strategy alters Keno’s built-in house edge. The most practical approach involves choosing a 4-to-6 spot count, managing your session budget strictly, and opting for games with higher published Return to Player (RTP) percentages.
What Is the Secret Pattern of Keno?
There is no secret pattern in Keno. Certified Random Number Generators ensure every ball draw is independent, making visual patterns, cluster picks, and scattered selections identical in mathematical probability.
What is the best way to predict Keno numbers?
Predicting upcoming Keno draws is impossible because outcomes are generated using certified RNG software. Historical logs display past events but carry no influence over upcoming draws.
Is there a winning strategy for Keno?
Because Keno outcomes are entirely random, no playing system guarantees long-term wins. Strategic control applies to bankroll management, spot count selection, and setting session limits.
What’s the difference between hot and cold Keno numbers?
Hot numbers are digits drawn frequently in recent short-term logs; cold numbers are digits absent over recent draws. Both classifications reflect historical variance rather than future drawing probability.
What are the most frequently drawn Keno numbers?
Numbers like 27, 35, 65, 50, and 12 frequently top historical draw lists across various platforms. However, these rankings shift constantly depending on the dataset. Because RNG systems reset probability on every draw, no number holds a lasting edge over another.
What is the house edge in Keno?
Keno’s house edge typically ranges between 20% and 35%, making it higher than most traditional table games. This built-in edge applies across all number combinations and spot counts over long-term play.
PokerListings 