Online Poker Market Share


 PokerListings
Since mid-October we’ve been actively monitoring the cash-game traffic of the leading online poker rooms to better understand how the market is distributed and how players behave over time.
This report is based on data collected between October 13 and October 27.
Data Methodology
We tracked real-time traffic from 12 popular poker rooms and collected a total of 162,021 entries with minute-by-minute updates.
Only real-money cash game seats were counted. Formats like Zoom/SNAP/Fast Forward, tournaments, Spin&Go-type games or play-money traffic were completely excluded.
Logged-in but inactive users also do not appear in the dataset. This means that the numbers you see refer only to seated cash-game players. We didn’t count unique players, so multi-tabling users increase the raw totals.
Market Distribution
According to our sample, GGPoker holds the leading position in October with an average ~36% market share among major rooms. PokerStars follows with ~25%, and WPT Global completes the Top-3 with around 15%. Together, these three ecosystems control roughly 76% of the observable cash-game market.
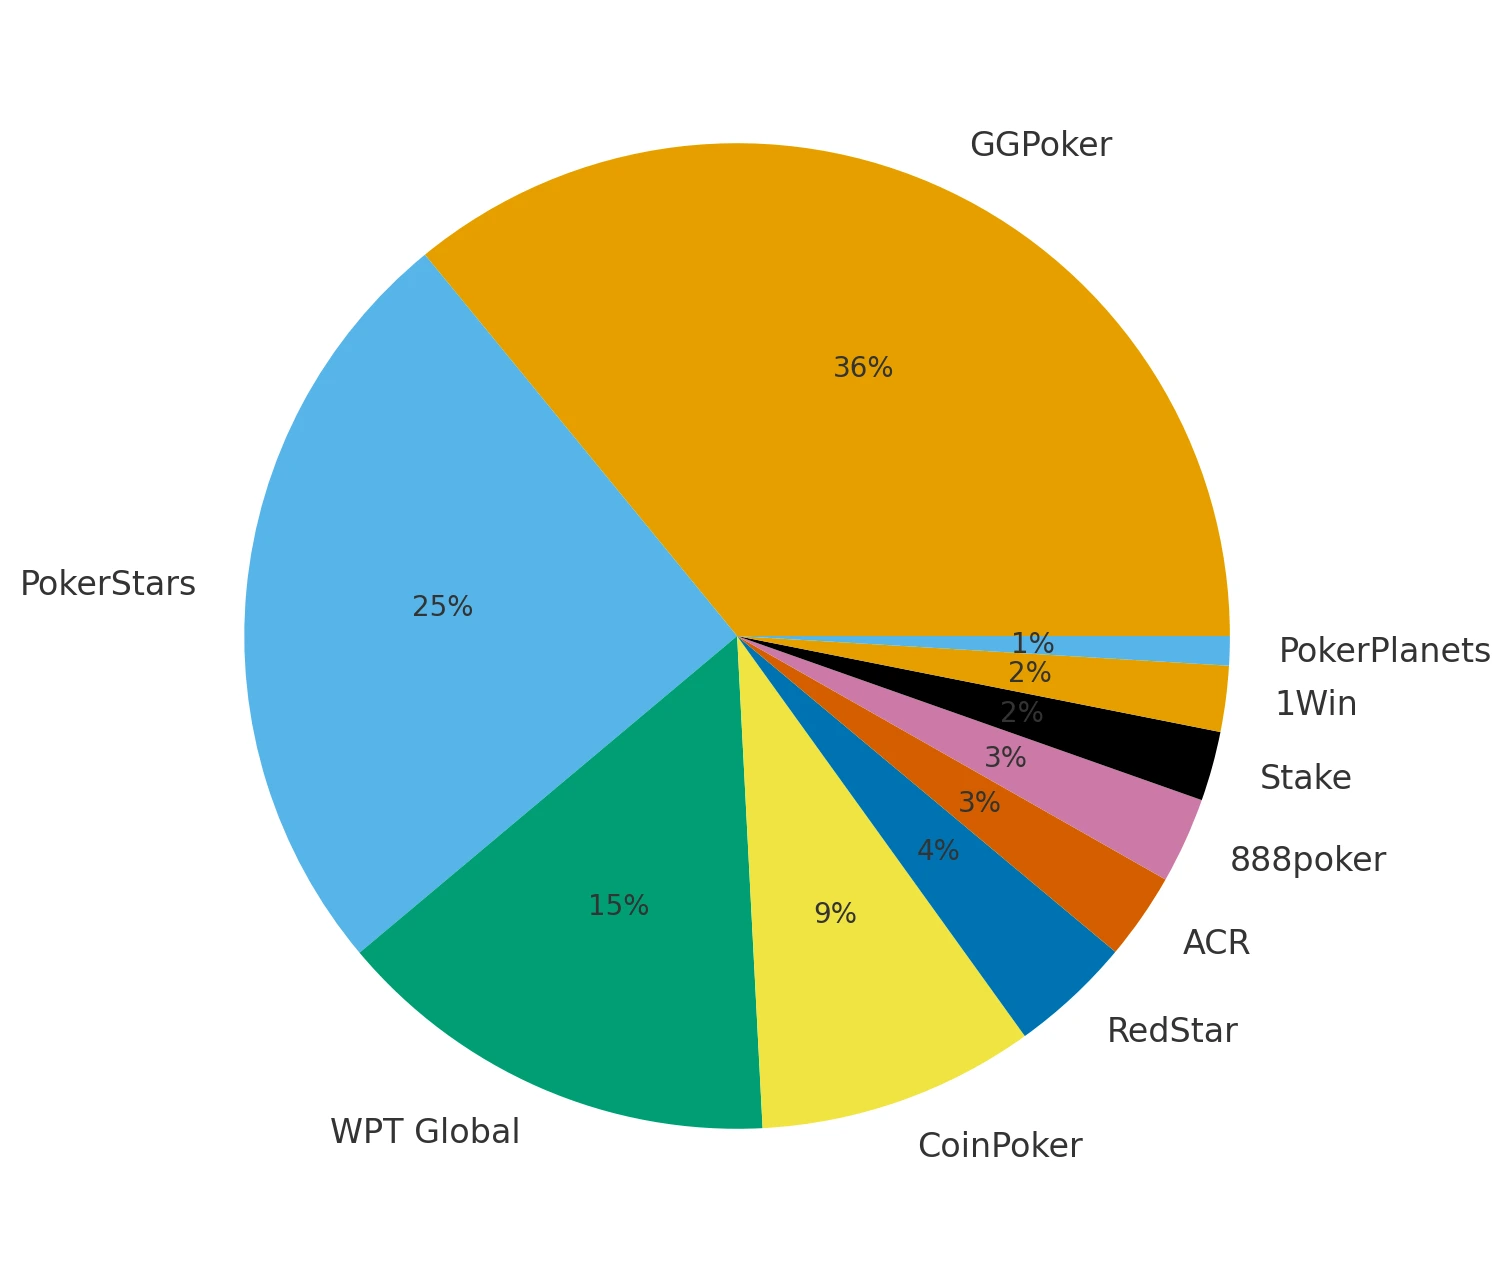
CoinPoker continues to grow and now captures around 9% of active real-money seats, strengthening its position ahead of ACR and 888poker.
This is what the market looks like dynamically over the two-week period:
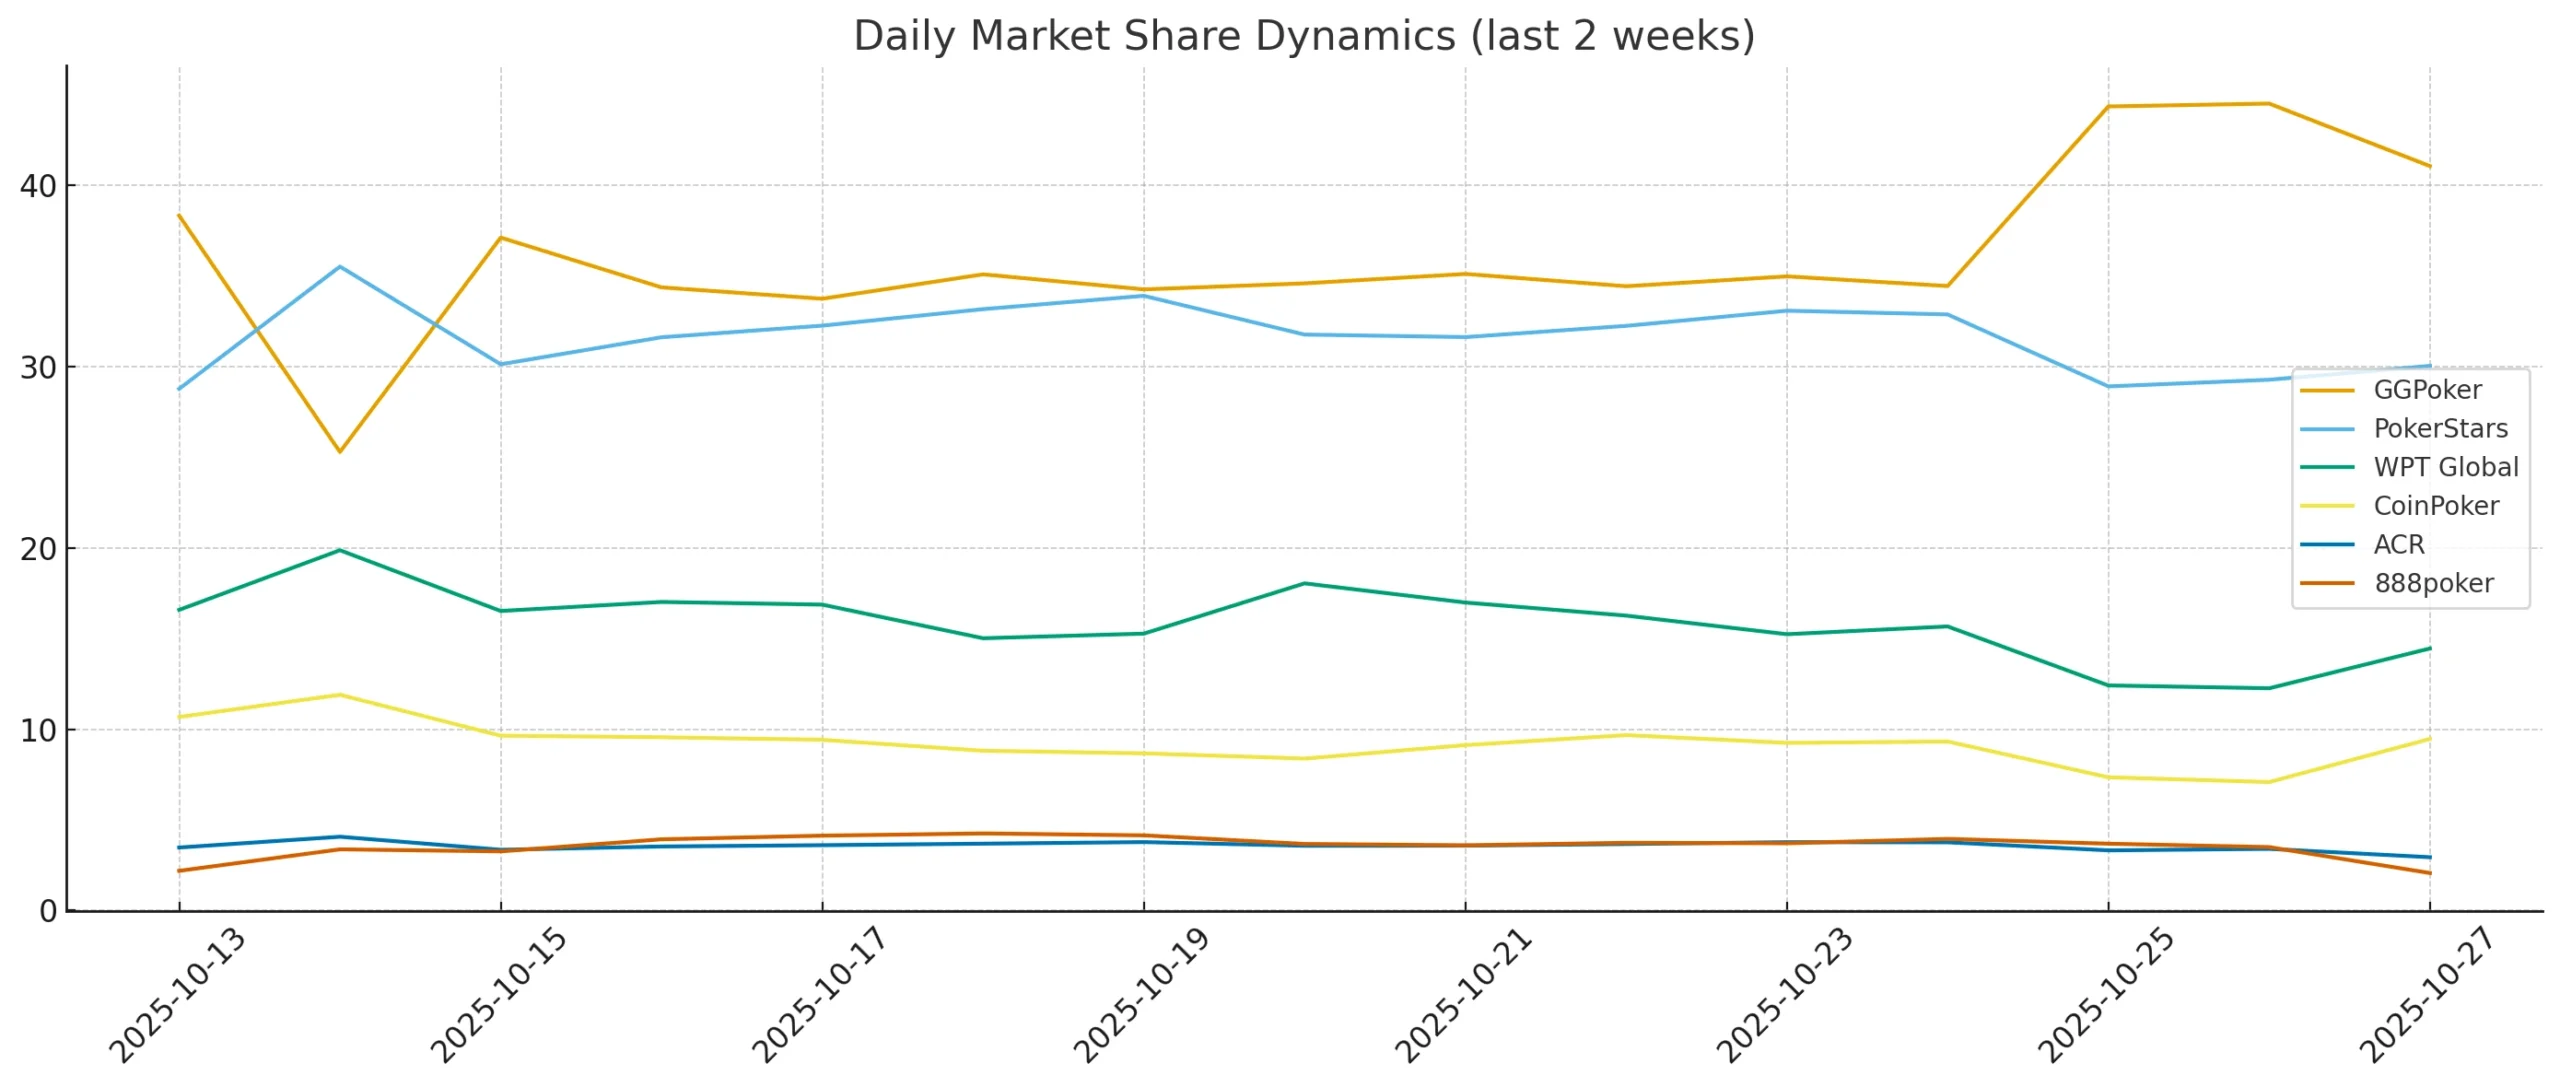
As you can see, GGPoker is not an uncontested leader at every moment — there are several points where PokerStars briefly overtakes GGPoker during peak activity windows.
Peak Activity
With hourly-level data available, we identified the core peak window for all rooms and compared it with the traffic patterns of operators that are more popular in different geographic regions.
This is what the weekly heatmap looks like for the top market leaders:
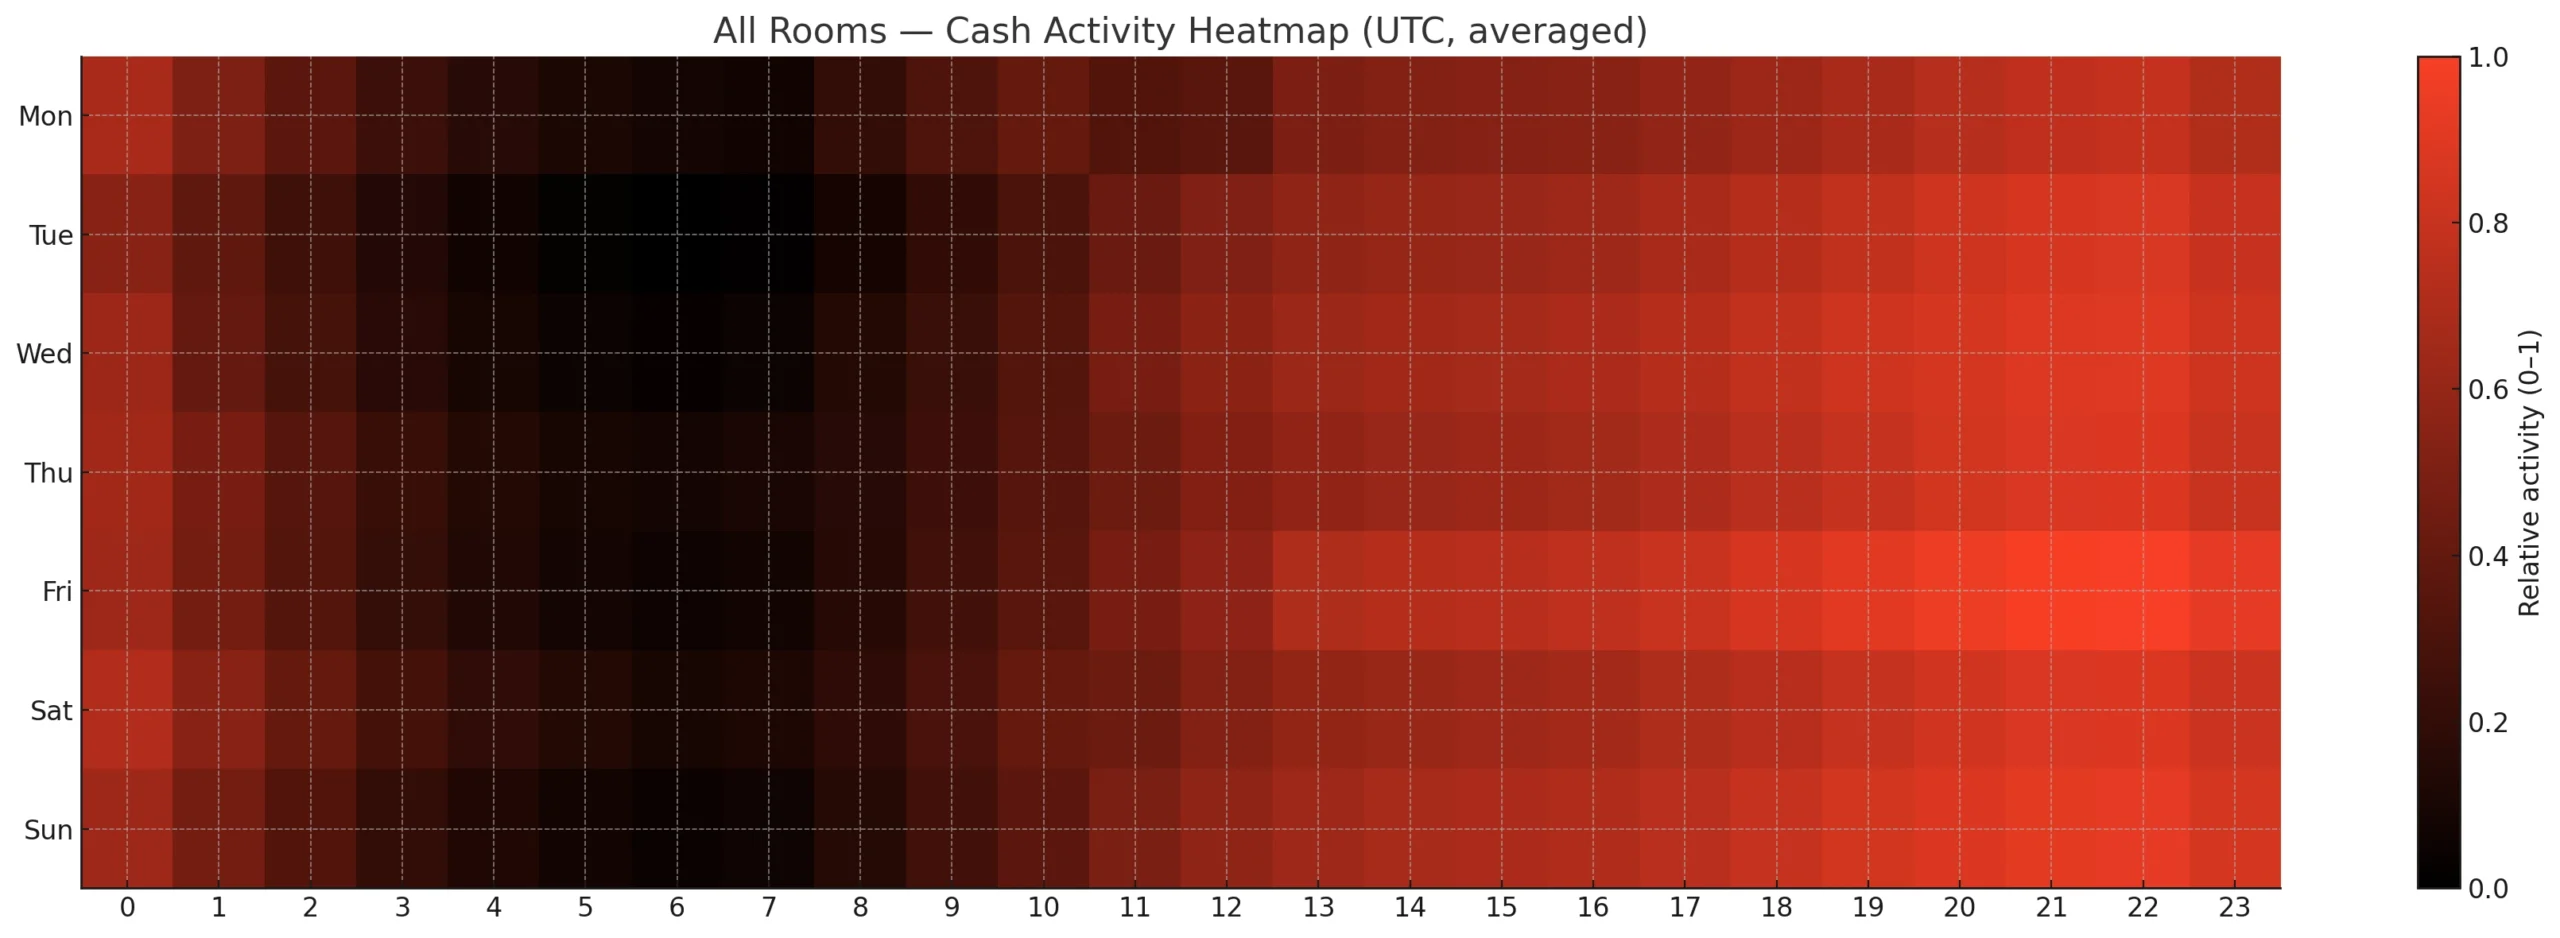
All rooms here are shown in UTC, and the industry-wide peak clearly aligns with Western European evening hours. The day-of-week distribution also matters: Friday evening is the single strongest moment to play online cash games.
To understand whether region-specific traffic behaves differently, we compared this pattern with an operator that is predominantly US-based: ClubWPT Gold.
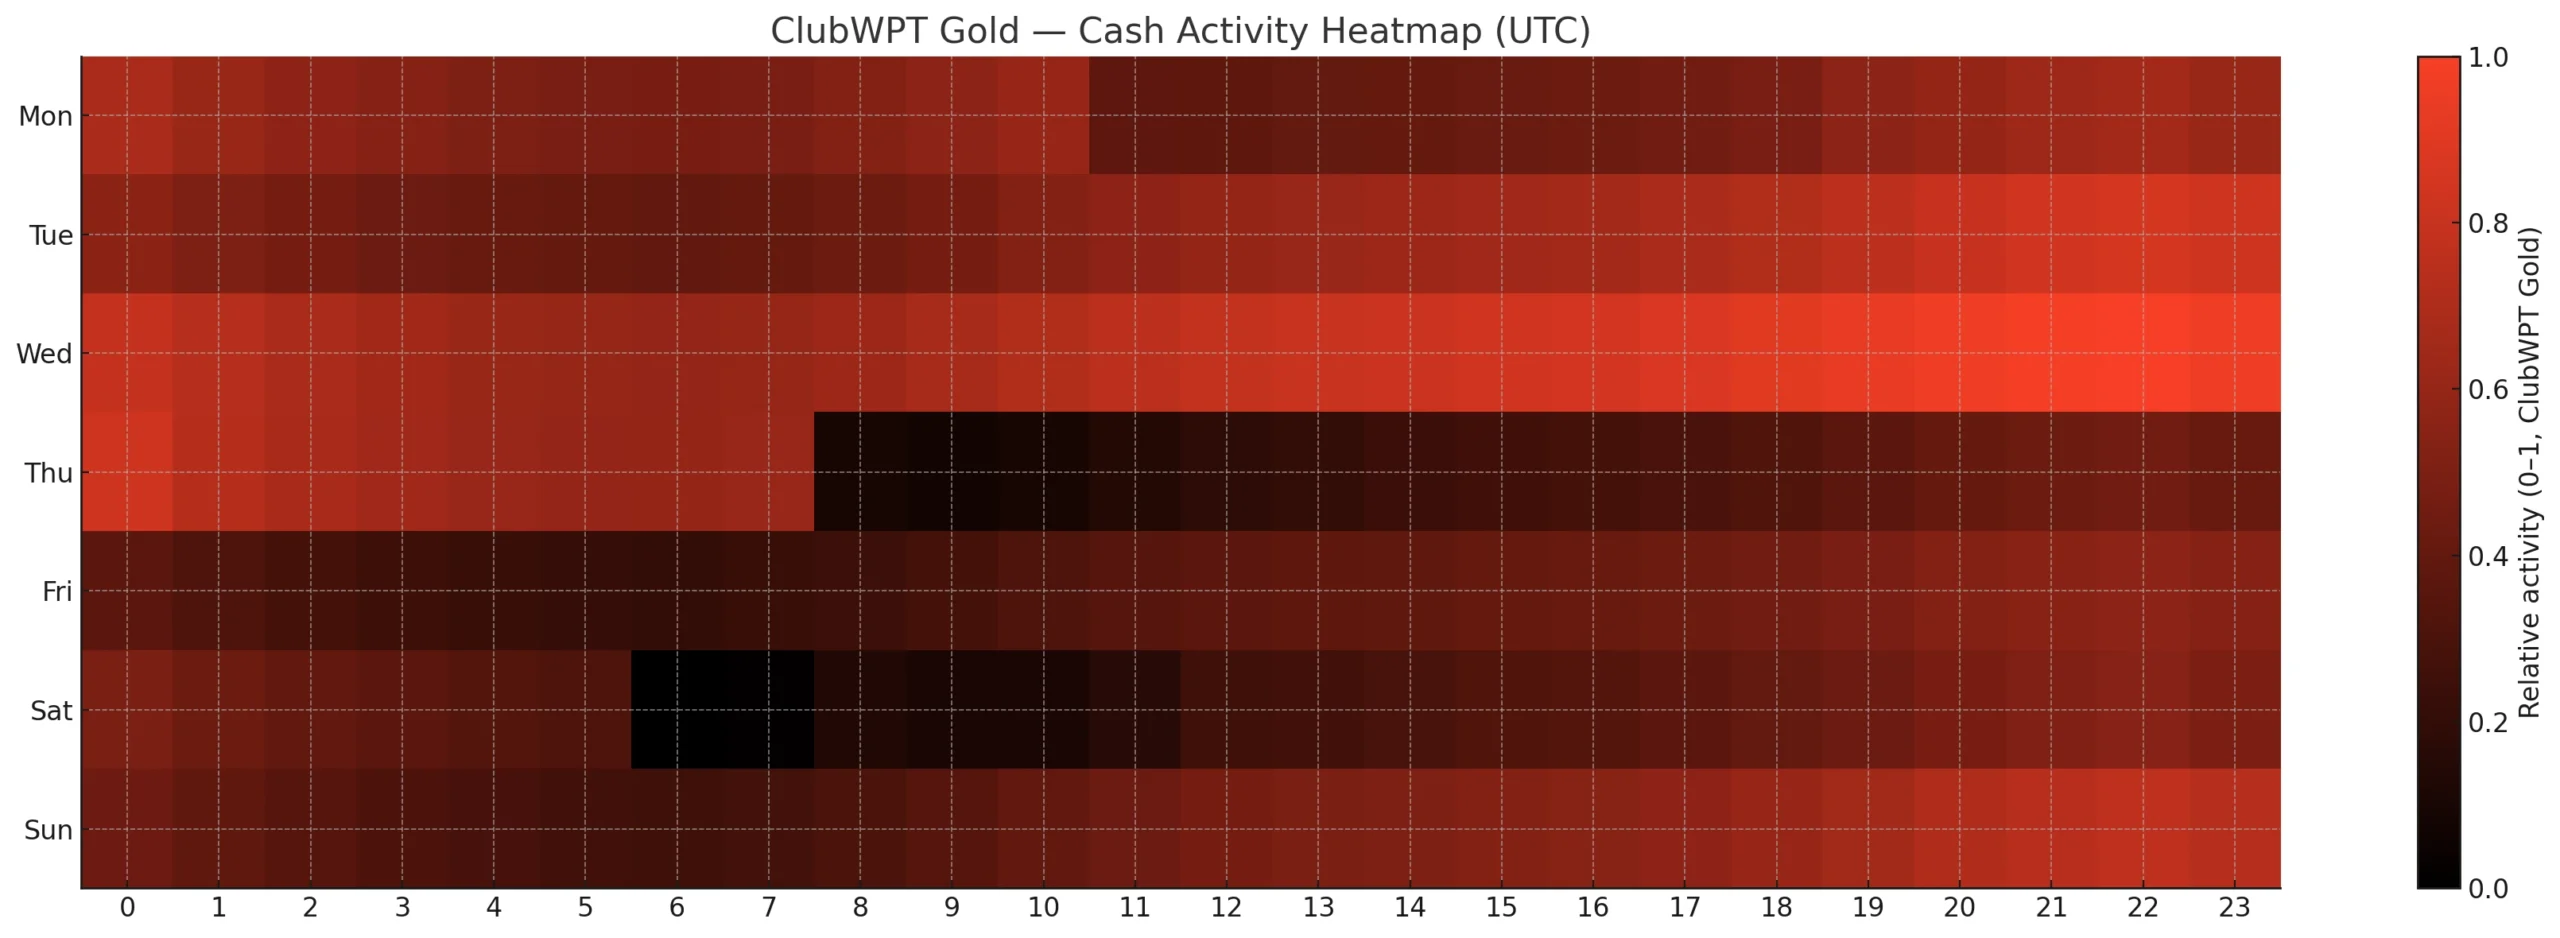
The US-profiled room shows a slightly longer tail after the peak, but overall the activity curve still closely aligns with the global pattern.
Our Findings
- Europe is the primary driver of cash-game market share.
- Smaller poker rooms have almost no influence on the overall picture — the market is highly concentrated.
- CoinPoker is growing, while 888poker continues to fall behind the leaders.
- PokerStars loses ground to GGPoker during evening and weekend peaks, but remains comparatively stable during weekdays. GGPoker captures the market during prime-time.
- ACR was expected to behave like a US-centric room, but in reality its peak pattern is closer to the European rooms. Meanwhile, ClubWPT clearly shows a US profile with a longer post-peak tail.
- Once night arrives in Europe, the entire market drops sharply — overseas traffic does not offset the decline.
- The US market impact is smaller than often assumed.
Recommended
-
- $55 Stake Cash + 260K Gold Coins
18+ | Play Responsibly | T&C Apply
-
- 100% up to $2000
18+ | Play Responsibly | T&C Apply
-
- 150% up to 2000$
+18 | T & C apply | Play responsible
-
- 100% up to $1000
18+ | Play Responsibly | T&C Apply
-
- 100% up to $1,000